Choctaw vs Immigrants from West Indies Single Female Poverty
COMPARE
Choctaw
Immigrants from West Indies
Single Female Poverty
Single Female Poverty Comparison
Choctaw
Immigrants from West Indies
27.2%
SINGLE FEMALE POVERTY
0.0/ 100
METRIC RATING
325th/ 347
METRIC RANK
22.5%
SINGLE FEMALE POVERTY
1.0/ 100
METRIC RATING
251st/ 347
METRIC RANK
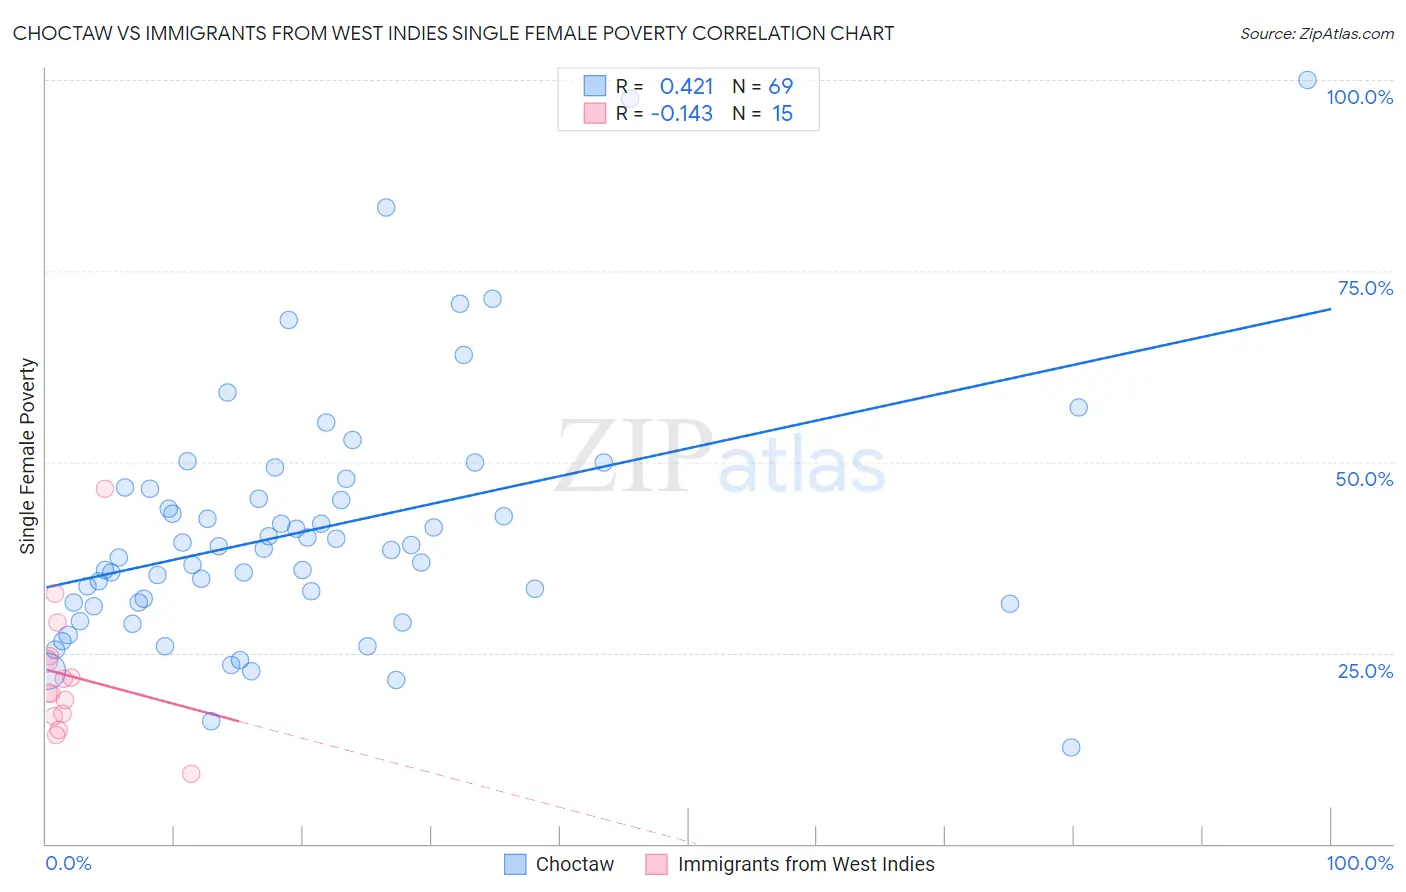
Choctaw vs Immigrants from West Indies Single Female Poverty Correlation Chart
The statistical analysis conducted on geographies consisting of 267,534,581 people shows a moderate positive correlation between the proportion of Choctaw and poverty level among single females in the United States with a correlation coefficient (R) of 0.421 and weighted average of 27.2%. Similarly, the statistical analysis conducted on geographies consisting of 72,360,150 people shows a poor negative correlation between the proportion of Immigrants from West Indies and poverty level among single females in the United States with a correlation coefficient (R) of -0.143 and weighted average of 22.5%, a difference of 20.9%.
Single Female Poverty Correlation Summary
| Measurement | Choctaw | Immigrants from West Indies |
| Minimum | 12.6% | 9.1% |
| Maximum | 100.0% | 46.4% |
| Range | 87.4% | 37.3% |
| Mean | 41.2% | 22.0% |
| Median | 38.6% | 19.7% |
| Interquartile 25% (IQ1) | 31.5% | 16.7% |
| Interquartile 75% (IQ3) | 46.6% | 24.5% |
| Interquartile Range (IQR) | 15.1% | 7.8% |
| Standard Deviation (Sample) | 16.5% | 9.0% |
| Standard Deviation (Population) | 16.4% | 8.7% |
Similar Demographics by Single Female Poverty
Demographics Similar to Choctaw by Single Female Poverty
In terms of single female poverty, the demographic groups most similar to Choctaw are Creek (27.4%, a difference of 0.88%), Dutch West Indian (27.5%, a difference of 0.96%), Kiowa (26.9%, a difference of 0.98%), Chippewa (26.8%, a difference of 1.4%), and Seminole (26.8%, a difference of 1.5%).
| Demographics | Rating | Rank | Single Female Poverty |
| Chickasaw | 0.0 /100 | #318 | Tragic 26.3% |
| Blacks/African Americans | 0.0 /100 | #319 | Tragic 26.4% |
| Arapaho | 0.0 /100 | #320 | Tragic 26.4% |
| Yup'ik | 0.0 /100 | #321 | Tragic 26.6% |
| Seminole | 0.0 /100 | #322 | Tragic 26.8% |
| Chippewa | 0.0 /100 | #323 | Tragic 26.8% |
| Kiowa | 0.0 /100 | #324 | Tragic 26.9% |
| Choctaw | 0.0 /100 | #325 | Tragic 27.2% |
| Creek | 0.0 /100 | #326 | Tragic 27.4% |
| Dutch West Indians | 0.0 /100 | #327 | Tragic 27.5% |
| Apache | 0.0 /100 | #328 | Tragic 27.7% |
| Menominee | 0.0 /100 | #329 | Tragic 27.8% |
| Hopi | 0.0 /100 | #330 | Tragic 28.0% |
| Natives/Alaskans | 0.0 /100 | #331 | Tragic 28.2% |
| Yakama | 0.0 /100 | #332 | Tragic 28.3% |
Demographics Similar to Immigrants from West Indies by Single Female Poverty
In terms of single female poverty, the demographic groups most similar to Immigrants from West Indies are Delaware (22.5%, a difference of 0.11%), Immigrants from Bahamas (22.5%, a difference of 0.14%), Immigrants from Liberia (22.5%, a difference of 0.20%), Immigrants from Caribbean (22.4%, a difference of 0.29%), and Immigrants from Burma/Myanmar (22.6%, a difference of 0.30%).
| Demographics | Rating | Rank | Single Female Poverty |
| Immigrants | Middle Africa | 1.9 /100 | #244 | Tragic 22.3% |
| Immigrants | Bangladesh | 1.8 /100 | #245 | Tragic 22.3% |
| Liberians | 1.4 /100 | #246 | Tragic 22.4% |
| Immigrants | El Salvador | 1.4 /100 | #247 | Tragic 22.4% |
| Belizeans | 1.4 /100 | #248 | Tragic 22.4% |
| Immigrants | Caribbean | 1.3 /100 | #249 | Tragic 22.4% |
| Immigrants | Bahamas | 1.2 /100 | #250 | Tragic 22.5% |
| Immigrants | West Indies | 1.0 /100 | #251 | Tragic 22.5% |
| Delaware | 1.0 /100 | #252 | Tragic 22.5% |
| Immigrants | Liberia | 0.9 /100 | #253 | Tragic 22.5% |
| Immigrants | Burma/Myanmar | 0.8 /100 | #254 | Tragic 22.6% |
| Immigrants | Sudan | 0.8 /100 | #255 | Tragic 22.6% |
| Immigrants | Belize | 0.8 /100 | #256 | Tragic 22.6% |
| Sudanese | 0.7 /100 | #257 | Tragic 22.6% |
| Bahamians | 0.6 /100 | #258 | Tragic 22.7% |