Sri Lankan vs Costa Rican Single Female Poverty
COMPARE
Sri Lankan
Costa Rican
Single Female Poverty
Single Female Poverty Comparison
Sri Lankans
Costa Ricans
19.2%
SINGLE FEMALE POVERTY
99.6/ 100
METRIC RATING
59th/ 347
METRIC RANK
20.7%
SINGLE FEMALE POVERTY
71.8/ 100
METRIC RATING
159th/ 347
METRIC RANK
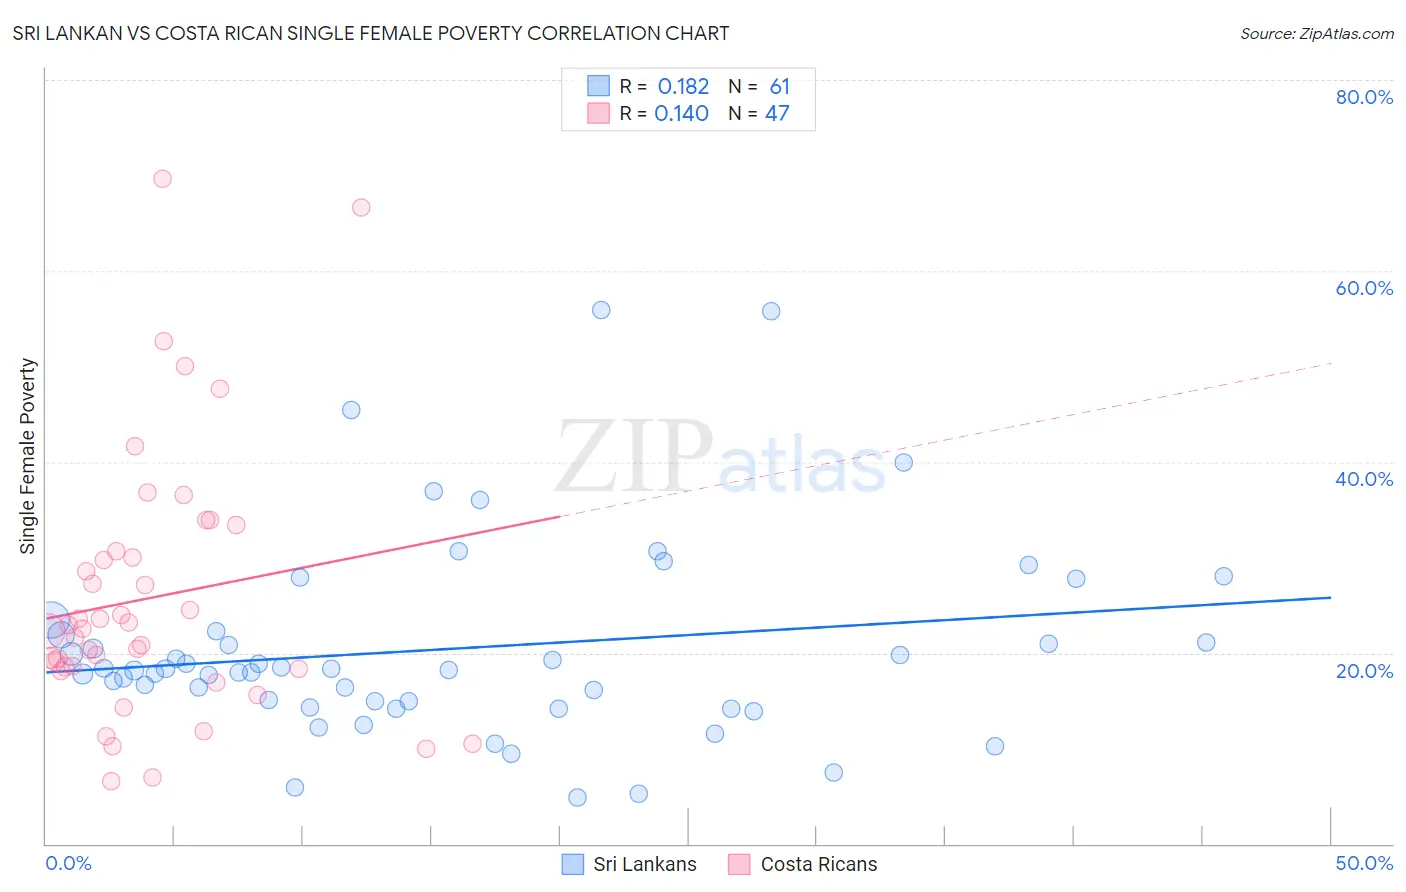
Sri Lankan vs Costa Rican Single Female Poverty Correlation Chart
The statistical analysis conducted on geographies consisting of 433,414,955 people shows a poor positive correlation between the proportion of Sri Lankans and poverty level among single females in the United States with a correlation coefficient (R) of 0.182 and weighted average of 19.2%. Similarly, the statistical analysis conducted on geographies consisting of 251,572,949 people shows a poor positive correlation between the proportion of Costa Ricans and poverty level among single females in the United States with a correlation coefficient (R) of 0.140 and weighted average of 20.7%, a difference of 8.0%.
Single Female Poverty Correlation Summary
| Measurement | Sri Lankan | Costa Rican |
| Minimum | 4.9% | 6.5% |
| Maximum | 56.0% | 69.6% |
| Range | 51.1% | 63.1% |
| Mean | 20.4% | 25.8% |
| Median | 18.2% | 22.6% |
| Interquartile 25% (IQ1) | 14.6% | 18.4% |
| Interquartile 75% (IQ3) | 22.0% | 30.7% |
| Interquartile Range (IQR) | 7.5% | 12.3% |
| Standard Deviation (Sample) | 10.3% | 13.9% |
| Standard Deviation (Population) | 10.3% | 13.7% |
Similar Demographics by Single Female Poverty
Demographics Similar to Sri Lankans by Single Female Poverty
In terms of single female poverty, the demographic groups most similar to Sri Lankans are Immigrants from Bulgaria (19.1%, a difference of 0.10%), Russian (19.2%, a difference of 0.10%), Cambodian (19.2%, a difference of 0.12%), Lithuanian (19.2%, a difference of 0.17%), and Eastern European (19.1%, a difference of 0.22%).
| Demographics | Rating | Rank | Single Female Poverty |
| Egyptians | 99.7 /100 | #52 | Exceptional 19.1% |
| Tsimshian | 99.7 /100 | #53 | Exceptional 19.1% |
| Argentineans | 99.7 /100 | #54 | Exceptional 19.1% |
| Immigrants | Vietnam | 99.7 /100 | #55 | Exceptional 19.1% |
| Immigrants | Fiji | 99.7 /100 | #56 | Exceptional 19.1% |
| Eastern Europeans | 99.7 /100 | #57 | Exceptional 19.1% |
| Immigrants | Bulgaria | 99.7 /100 | #58 | Exceptional 19.1% |
| Sri Lankans | 99.6 /100 | #59 | Exceptional 19.2% |
| Russians | 99.6 /100 | #60 | Exceptional 19.2% |
| Cambodians | 99.6 /100 | #61 | Exceptional 19.2% |
| Lithuanians | 99.6 /100 | #62 | Exceptional 19.2% |
| Immigrants | Northern Europe | 99.6 /100 | #63 | Exceptional 19.2% |
| Immigrants | Europe | 99.6 /100 | #64 | Exceptional 19.2% |
| Cypriots | 99.6 /100 | #65 | Exceptional 19.2% |
| Palestinians | 99.6 /100 | #66 | Exceptional 19.2% |
Demographics Similar to Costa Ricans by Single Female Poverty
In terms of single female poverty, the demographic groups most similar to Costa Ricans are Arab (20.7%, a difference of 0.080%), Danish (20.7%, a difference of 0.090%), Immigrants from Oceania (20.7%, a difference of 0.20%), Kenyan (20.8%, a difference of 0.25%), and Northern European (20.8%, a difference of 0.26%).
| Demographics | Rating | Rank | Single Female Poverty |
| Immigrants | Uruguay | 77.7 /100 | #152 | Good 20.6% |
| Swedes | 77.1 /100 | #153 | Good 20.6% |
| Immigrants | Western Europe | 76.7 /100 | #154 | Good 20.6% |
| Samoans | 76.0 /100 | #155 | Good 20.6% |
| South American Indians | 75.7 /100 | #156 | Good 20.6% |
| Immigrants | Oceania | 74.3 /100 | #157 | Good 20.7% |
| Danes | 73.0 /100 | #158 | Good 20.7% |
| Costa Ricans | 71.8 /100 | #159 | Good 20.7% |
| Arabs | 70.8 /100 | #160 | Good 20.7% |
| Kenyans | 68.5 /100 | #161 | Good 20.8% |
| Northern Europeans | 68.4 /100 | #162 | Good 20.8% |
| Lebanese | 67.6 /100 | #163 | Good 20.8% |
| Iraqis | 64.5 /100 | #164 | Good 20.8% |
| Ugandans | 64.0 /100 | #165 | Good 20.8% |
| Norwegians | 63.0 /100 | #166 | Good 20.8% |