Choctaw vs Costa Rican Female Poverty
COMPARE
Choctaw
Costa Rican
Female Poverty
Female Poverty Comparison
Choctaw
Costa Ricans
16.8%
FEMALE POVERTY
0.0/ 100
METRIC RATING
303rd/ 347
METRIC RANK
13.3%
FEMALE POVERTY
63.6/ 100
METRIC RATING
159th/ 347
METRIC RANK
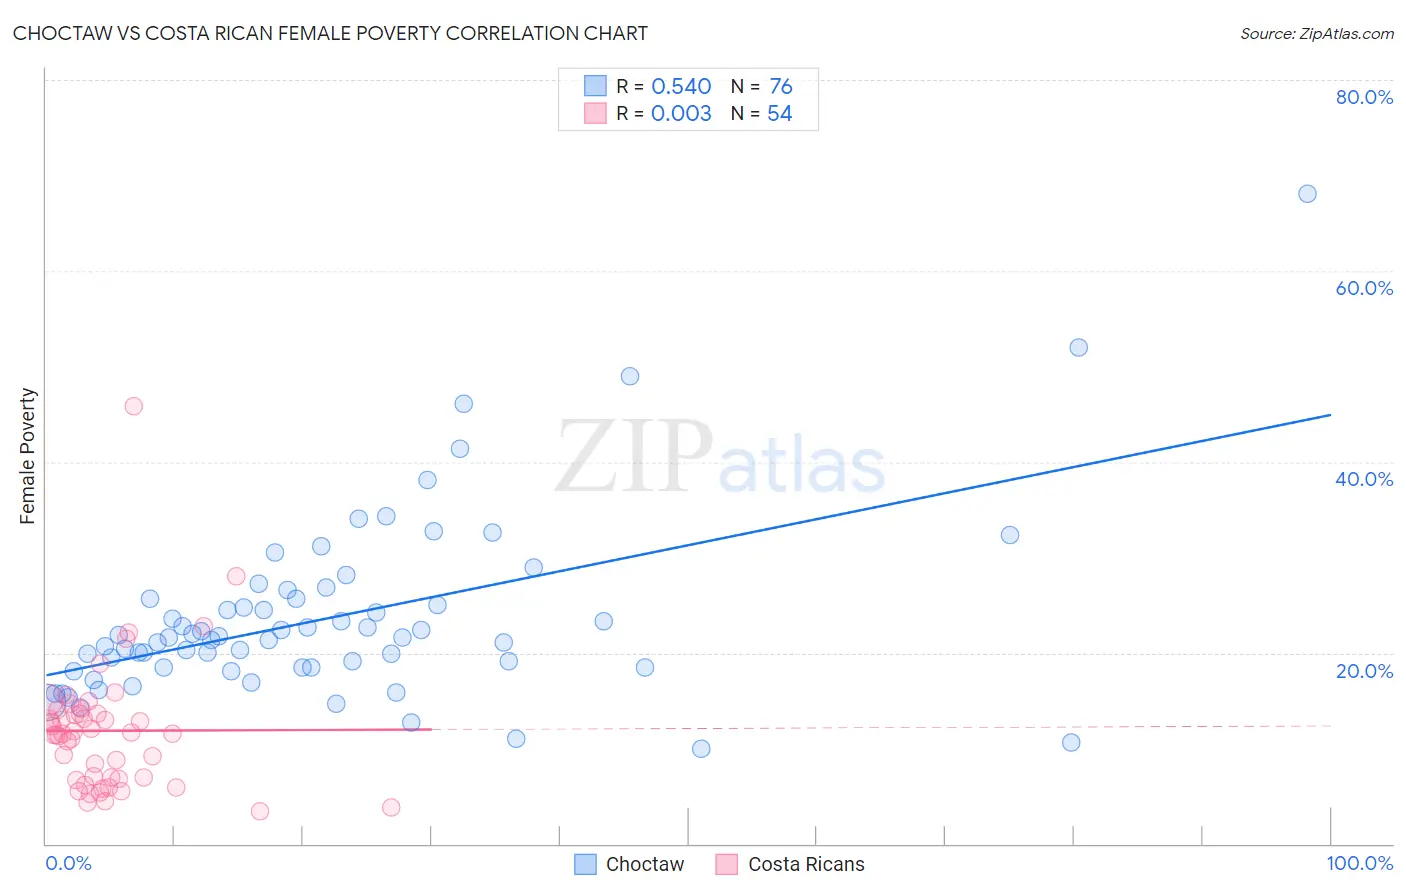
Choctaw vs Costa Rican Female Poverty Correlation Chart
The statistical analysis conducted on geographies consisting of 269,592,766 people shows a substantial positive correlation between the proportion of Choctaw and poverty level among females in the United States with a correlation coefficient (R) of 0.540 and weighted average of 16.8%. Similarly, the statistical analysis conducted on geographies consisting of 253,437,784 people shows no correlation between the proportion of Costa Ricans and poverty level among females in the United States with a correlation coefficient (R) of 0.003 and weighted average of 13.3%, a difference of 26.8%.
Female Poverty Correlation Summary
| Measurement | Choctaw | Costa Rican |
| Minimum | 10.0% | 3.4% |
| Maximum | 68.1% | 45.8% |
| Range | 58.1% | 42.4% |
| Mean | 23.7% | 11.8% |
| Median | 21.6% | 11.5% |
| Interquartile 25% (IQ1) | 18.4% | 6.8% |
| Interquartile 75% (IQ3) | 25.6% | 13.6% |
| Interquartile Range (IQR) | 7.2% | 6.8% |
| Standard Deviation (Sample) | 9.5% | 7.0% |
| Standard Deviation (Population) | 9.5% | 6.9% |
Similar Demographics by Female Poverty
Demographics Similar to Choctaw by Female Poverty
In terms of female poverty, the demographic groups most similar to Choctaw are Immigrants from Central America (16.8%, a difference of 0.060%), Immigrants from Grenada (16.8%, a difference of 0.070%), Immigrants from Caribbean (16.9%, a difference of 0.33%), Seminole (16.9%, a difference of 0.46%), and African (16.9%, a difference of 0.52%).
| Demographics | Rating | Rank | Female Poverty |
| Immigrants | Senegal | 0.0 /100 | #296 | Tragic 16.5% |
| Mexicans | 0.0 /100 | #297 | Tragic 16.5% |
| Somalis | 0.0 /100 | #298 | Tragic 16.6% |
| Hispanics or Latinos | 0.0 /100 | #299 | Tragic 16.6% |
| Bahamians | 0.0 /100 | #300 | Tragic 16.6% |
| Guatemalans | 0.0 /100 | #301 | Tragic 16.7% |
| Chippewa | 0.0 /100 | #302 | Tragic 16.7% |
| Choctaw | 0.0 /100 | #303 | Tragic 16.8% |
| Immigrants | Central America | 0.0 /100 | #304 | Tragic 16.8% |
| Immigrants | Grenada | 0.0 /100 | #305 | Tragic 16.8% |
| Immigrants | Caribbean | 0.0 /100 | #306 | Tragic 16.9% |
| Seminole | 0.0 /100 | #307 | Tragic 16.9% |
| Africans | 0.0 /100 | #308 | Tragic 16.9% |
| Immigrants | Mexico | 0.0 /100 | #309 | Tragic 17.0% |
| Creek | 0.0 /100 | #310 | Tragic 17.0% |
Demographics Similar to Costa Ricans by Female Poverty
In terms of female poverty, the demographic groups most similar to Costa Ricans are Immigrants from Nepal (13.3%, a difference of 0.090%), Immigrants from Ethiopia (13.3%, a difference of 0.12%), Guamanian/Chamorro (13.3%, a difference of 0.12%), Immigrants from Albania (13.3%, a difference of 0.13%), and Ethiopian (13.3%, a difference of 0.14%).
| Demographics | Rating | Rank | Female Poverty |
| Samoans | 73.6 /100 | #152 | Good 13.1% |
| Immigrants | Fiji | 71.0 /100 | #153 | Good 13.2% |
| Armenians | 70.4 /100 | #154 | Good 13.2% |
| Hungarians | 70.1 /100 | #155 | Good 13.2% |
| Immigrants | Bosnia and Herzegovina | 69.7 /100 | #156 | Good 13.2% |
| Immigrants | Northern Africa | 68.8 /100 | #157 | Good 13.2% |
| Pennsylvania Germans | 67.3 /100 | #158 | Good 13.2% |
| Costa Ricans | 63.6 /100 | #159 | Good 13.3% |
| Immigrants | Nepal | 62.7 /100 | #160 | Good 13.3% |
| Immigrants | Ethiopia | 62.5 /100 | #161 | Good 13.3% |
| Guamanians/Chamorros | 62.4 /100 | #162 | Good 13.3% |
| Immigrants | Albania | 62.4 /100 | #163 | Good 13.3% |
| Ethiopians | 62.3 /100 | #164 | Good 13.3% |
| Scotch-Irish | 62.1 /100 | #165 | Good 13.3% |
| Immigrants | Oceania | 59.7 /100 | #166 | Average 13.3% |