Cheyenne vs Chippewa Female Poverty
COMPARE
Cheyenne
Chippewa
Female Poverty
Female Poverty Comparison
Cheyenne
Chippewa
20.2%
FEMALE POVERTY
0.0/ 100
METRIC RATING
335th/ 347
METRIC RANK
16.7%
FEMALE POVERTY
0.0/ 100
METRIC RATING
302nd/ 347
METRIC RANK
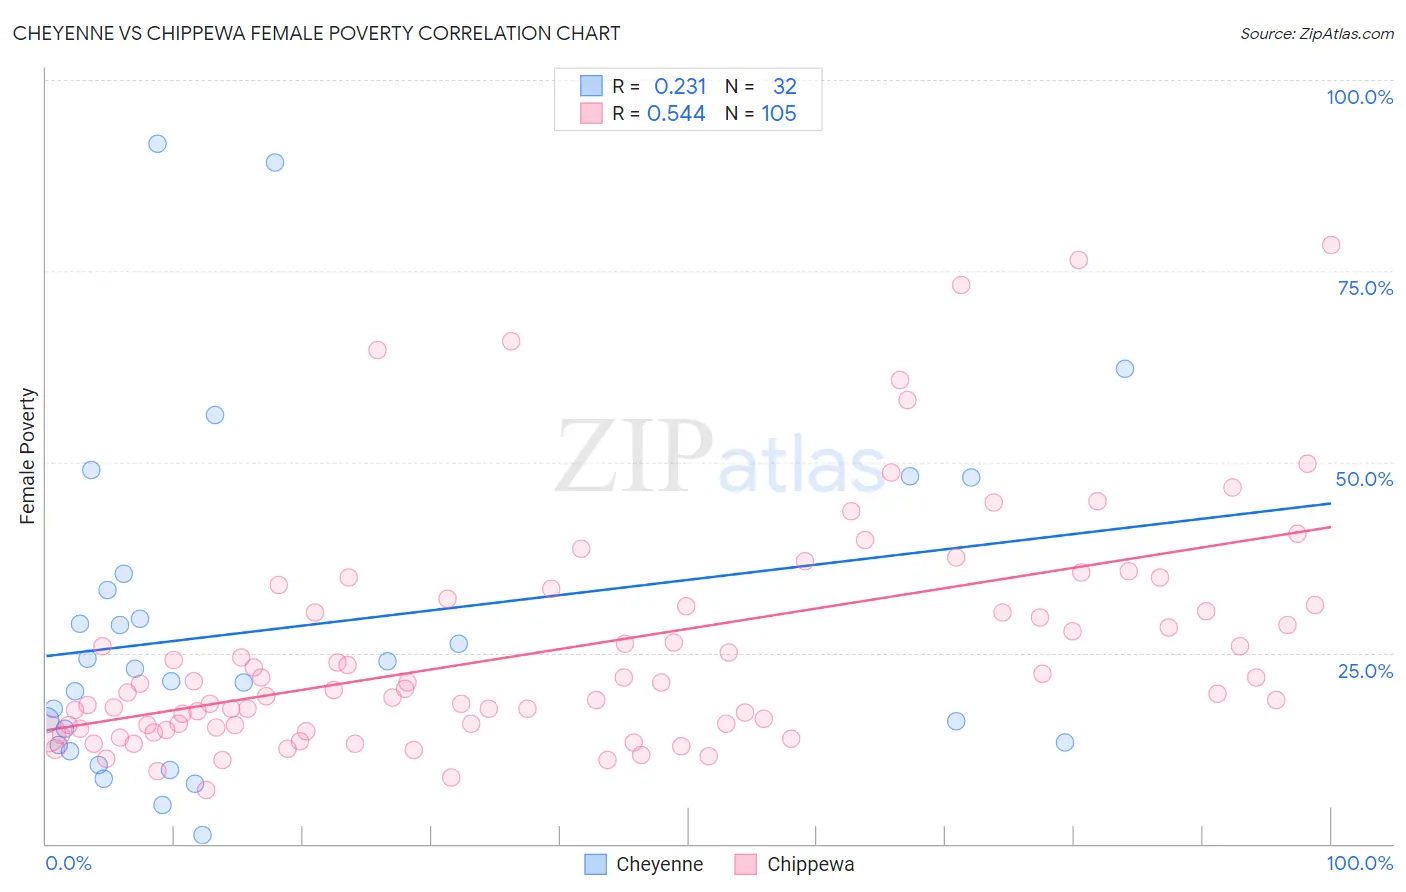
Cheyenne vs Chippewa Female Poverty Correlation Chart
The statistical analysis conducted on geographies consisting of 80,704,205 people shows a weak positive correlation between the proportion of Cheyenne and poverty level among females in the United States with a correlation coefficient (R) of 0.231 and weighted average of 20.2%. Similarly, the statistical analysis conducted on geographies consisting of 214,995,312 people shows a substantial positive correlation between the proportion of Chippewa and poverty level among females in the United States with a correlation coefficient (R) of 0.544 and weighted average of 16.7%, a difference of 20.9%.
Female Poverty Correlation Summary
| Measurement | Cheyenne | Chippewa |
| Minimum | 1.1% | 7.0% |
| Maximum | 91.7% | 78.4% |
| Range | 90.6% | 71.4% |
| Mean | 28.3% | 25.6% |
| Median | 22.0% | 20.4% |
| Interquartile 25% (IQ1) | 13.1% | 15.3% |
| Interquartile 75% (IQ3) | 34.3% | 31.2% |
| Interquartile Range (IQR) | 21.2% | 15.8% |
| Standard Deviation (Sample) | 22.2% | 15.1% |
| Standard Deviation (Population) | 21.8% | 15.0% |
Similar Demographics by Female Poverty
Demographics Similar to Cheyenne by Female Poverty
In terms of female poverty, the demographic groups most similar to Cheyenne are Houma (20.0%, a difference of 0.77%), Pueblo (20.7%, a difference of 2.4%), Yuman (20.8%, a difference of 3.2%), Sioux (20.9%, a difference of 3.4%), and Hopi (21.0%, a difference of 3.8%).
| Demographics | Rating | Rank | Female Poverty |
| Blacks/African Americans | 0.0 /100 | #328 | Tragic 18.6% |
| Kiowa | 0.0 /100 | #329 | Tragic 18.6% |
| Dominicans | 0.0 /100 | #330 | Tragic 19.1% |
| Natives/Alaskans | 0.0 /100 | #331 | Tragic 19.2% |
| Apache | 0.0 /100 | #332 | Tragic 19.2% |
| Immigrants | Dominican Republic | 0.0 /100 | #333 | Tragic 19.3% |
| Houma | 0.0 /100 | #334 | Tragic 20.0% |
| Cheyenne | 0.0 /100 | #335 | Tragic 20.2% |
| Pueblo | 0.0 /100 | #336 | Tragic 20.7% |
| Yuman | 0.0 /100 | #337 | Tragic 20.8% |
| Sioux | 0.0 /100 | #338 | Tragic 20.9% |
| Hopi | 0.0 /100 | #339 | Tragic 21.0% |
| Yup'ik | 0.0 /100 | #340 | Tragic 21.5% |
| Crow | 0.0 /100 | #341 | Tragic 22.1% |
| Immigrants | Yemen | 0.0 /100 | #342 | Tragic 22.8% |
Demographics Similar to Chippewa by Female Poverty
In terms of female poverty, the demographic groups most similar to Chippewa are Guatemalan (16.7%, a difference of 0.030%), Bahamian (16.6%, a difference of 0.36%), Hispanic or Latino (16.6%, a difference of 0.40%), Choctaw (16.8%, a difference of 0.61%), and Immigrants from Central America (16.8%, a difference of 0.67%).
| Demographics | Rating | Rank | Female Poverty |
| Senegalese | 0.0 /100 | #295 | Tragic 16.5% |
| Immigrants | Senegal | 0.0 /100 | #296 | Tragic 16.5% |
| Mexicans | 0.0 /100 | #297 | Tragic 16.5% |
| Somalis | 0.0 /100 | #298 | Tragic 16.6% |
| Hispanics or Latinos | 0.0 /100 | #299 | Tragic 16.6% |
| Bahamians | 0.0 /100 | #300 | Tragic 16.6% |
| Guatemalans | 0.0 /100 | #301 | Tragic 16.7% |
| Chippewa | 0.0 /100 | #302 | Tragic 16.7% |
| Choctaw | 0.0 /100 | #303 | Tragic 16.8% |
| Immigrants | Central America | 0.0 /100 | #304 | Tragic 16.8% |
| Immigrants | Grenada | 0.0 /100 | #305 | Tragic 16.8% |
| Immigrants | Caribbean | 0.0 /100 | #306 | Tragic 16.9% |
| Seminole | 0.0 /100 | #307 | Tragic 16.9% |
| Africans | 0.0 /100 | #308 | Tragic 16.9% |
| Immigrants | Mexico | 0.0 /100 | #309 | Tragic 17.0% |