French vs Chippewa Female Poverty
COMPARE
French
Chippewa
Female Poverty
Female Poverty Comparison
French
Chippewa
12.9%
FEMALE POVERTY
85.6/ 100
METRIC RATING
135th/ 347
METRIC RANK
16.7%
FEMALE POVERTY
0.0/ 100
METRIC RATING
302nd/ 347
METRIC RANK
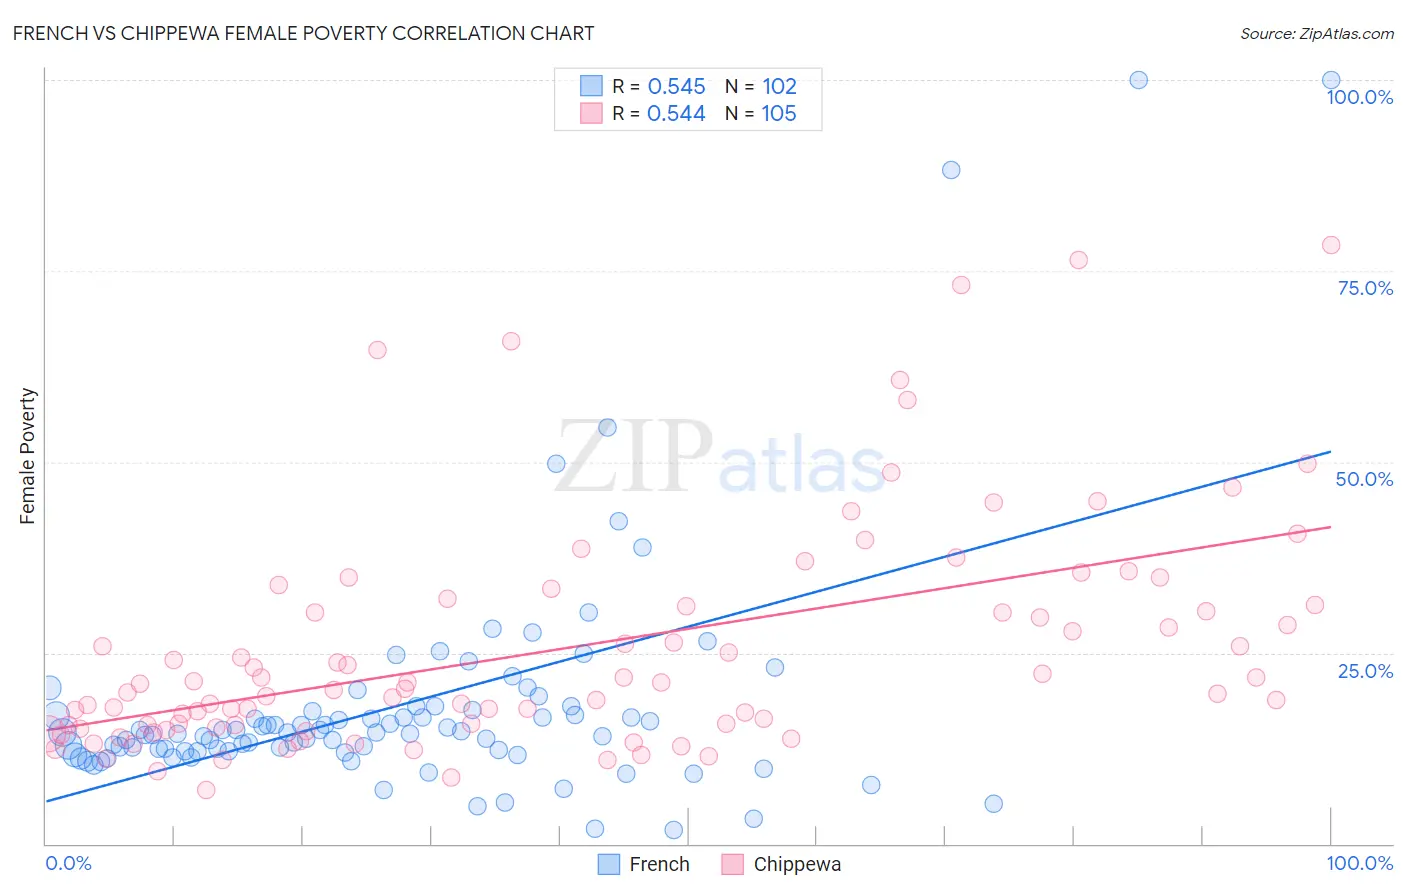
French vs Chippewa Female Poverty Correlation Chart
The statistical analysis conducted on geographies consisting of 571,140,753 people shows a substantial positive correlation between the proportion of French and poverty level among females in the United States with a correlation coefficient (R) of 0.545 and weighted average of 12.9%. Similarly, the statistical analysis conducted on geographies consisting of 214,995,312 people shows a substantial positive correlation between the proportion of Chippewa and poverty level among females in the United States with a correlation coefficient (R) of 0.544 and weighted average of 16.7%, a difference of 29.9%.
Female Poverty Correlation Summary
| Measurement | French | Chippewa |
| Minimum | 1.8% | 7.0% |
| Maximum | 100.0% | 78.4% |
| Range | 98.2% | 71.4% |
| Mean | 18.1% | 25.6% |
| Median | 14.5% | 20.4% |
| Interquartile 25% (IQ1) | 12.1% | 15.3% |
| Interquartile 75% (IQ3) | 17.4% | 31.2% |
| Interquartile Range (IQR) | 5.3% | 15.8% |
| Standard Deviation (Sample) | 15.9% | 15.1% |
| Standard Deviation (Population) | 15.8% | 15.0% |
Similar Demographics by Female Poverty
Demographics Similar to French by Female Poverty
In terms of female poverty, the demographic groups most similar to French are Immigrants from Switzerland (12.9%, a difference of 0.050%), Peruvian (12.9%, a difference of 0.080%), Chilean (12.9%, a difference of 0.17%), Immigrants from Western Europe (12.8%, a difference of 0.22%), and Immigrants from Jordan (12.8%, a difference of 0.28%).
| Demographics | Rating | Rank | Female Poverty |
| Immigrants | Belarus | 88.2 /100 | #128 | Excellent 12.8% |
| Immigrants | Brazil | 87.9 /100 | #129 | Excellent 12.8% |
| Immigrants | Vietnam | 87.1 /100 | #130 | Excellent 12.8% |
| Immigrants | Argentina | 87.0 /100 | #131 | Excellent 12.8% |
| Immigrants | Jordan | 86.9 /100 | #132 | Excellent 12.8% |
| Immigrants | Western Europe | 86.6 /100 | #133 | Excellent 12.8% |
| Immigrants | Switzerland | 85.8 /100 | #134 | Excellent 12.9% |
| French | 85.6 /100 | #135 | Excellent 12.9% |
| Peruvians | 85.2 /100 | #136 | Excellent 12.9% |
| Chileans | 84.7 /100 | #137 | Excellent 12.9% |
| Immigrants | France | 83.6 /100 | #138 | Excellent 12.9% |
| Basques | 83.1 /100 | #139 | Excellent 12.9% |
| Pakistanis | 83.0 /100 | #140 | Excellent 12.9% |
| Icelanders | 81.1 /100 | #141 | Excellent 13.0% |
| Brazilians | 80.5 /100 | #142 | Excellent 13.0% |
Demographics Similar to Chippewa by Female Poverty
In terms of female poverty, the demographic groups most similar to Chippewa are Guatemalan (16.7%, a difference of 0.030%), Bahamian (16.6%, a difference of 0.36%), Hispanic or Latino (16.6%, a difference of 0.40%), Choctaw (16.8%, a difference of 0.61%), and Immigrants from Central America (16.8%, a difference of 0.67%).
| Demographics | Rating | Rank | Female Poverty |
| Senegalese | 0.0 /100 | #295 | Tragic 16.5% |
| Immigrants | Senegal | 0.0 /100 | #296 | Tragic 16.5% |
| Mexicans | 0.0 /100 | #297 | Tragic 16.5% |
| Somalis | 0.0 /100 | #298 | Tragic 16.6% |
| Hispanics or Latinos | 0.0 /100 | #299 | Tragic 16.6% |
| Bahamians | 0.0 /100 | #300 | Tragic 16.6% |
| Guatemalans | 0.0 /100 | #301 | Tragic 16.7% |
| Chippewa | 0.0 /100 | #302 | Tragic 16.7% |
| Choctaw | 0.0 /100 | #303 | Tragic 16.8% |
| Immigrants | Central America | 0.0 /100 | #304 | Tragic 16.8% |
| Immigrants | Grenada | 0.0 /100 | #305 | Tragic 16.8% |
| Immigrants | Caribbean | 0.0 /100 | #306 | Tragic 16.9% |
| Seminole | 0.0 /100 | #307 | Tragic 16.9% |
| Africans | 0.0 /100 | #308 | Tragic 16.9% |
| Immigrants | Mexico | 0.0 /100 | #309 | Tragic 17.0% |