Cheyenne vs Chippewa 9th Grade
COMPARE
Cheyenne
Chippewa
9th Grade
9th Grade Comparison
Cheyenne
Chippewa
94.9%
9TH GRADE
51.5/ 100
METRIC RATING
173rd/ 347
METRIC RANK
96.1%
9TH GRADE
99.9/ 100
METRIC RATING
42nd/ 347
METRIC RANK
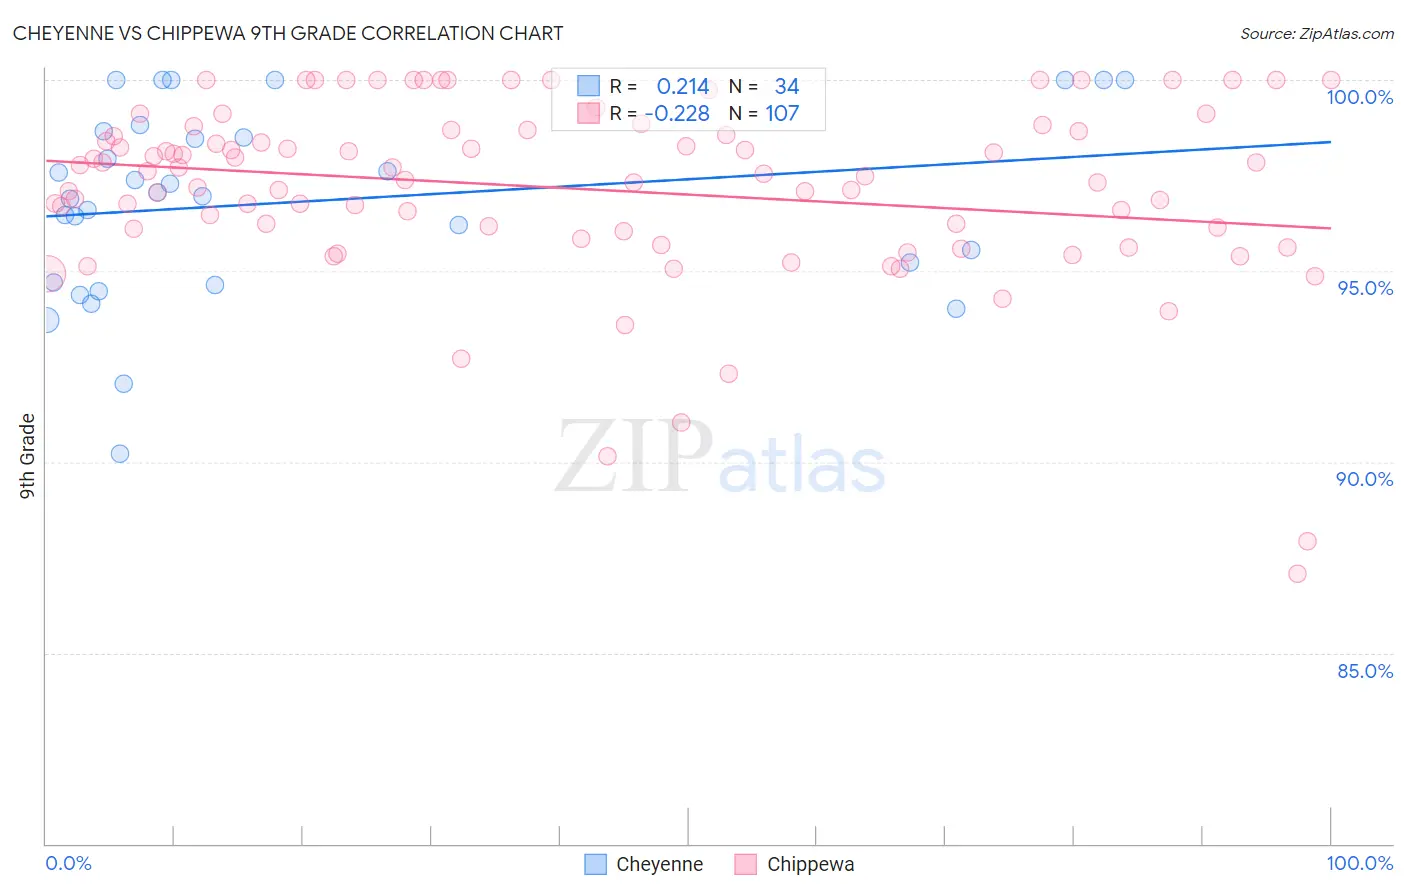
Cheyenne vs Chippewa 9th Grade Correlation Chart
The statistical analysis conducted on geographies consisting of 80,719,411 people shows a weak positive correlation between the proportion of Cheyenne and percentage of population with at least 9th grade education in the United States with a correlation coefficient (R) of 0.214 and weighted average of 94.9%. Similarly, the statistical analysis conducted on geographies consisting of 215,065,864 people shows a weak negative correlation between the proportion of Chippewa and percentage of population with at least 9th grade education in the United States with a correlation coefficient (R) of -0.228 and weighted average of 96.1%, a difference of 1.3%.
9th Grade Correlation Summary
| Measurement | Cheyenne | Chippewa |
| Minimum | 90.2% | 87.1% |
| Maximum | 100.0% | 100.0% |
| Range | 9.8% | 12.9% |
| Mean | 96.8% | 97.2% |
| Median | 97.0% | 97.5% |
| Interquartile 25% (IQ1) | 94.7% | 96.0% |
| Interquartile 75% (IQ3) | 98.7% | 98.7% |
| Interquartile Range (IQR) | 4.0% | 2.7% |
| Standard Deviation (Sample) | 2.5% | 2.4% |
| Standard Deviation (Population) | 2.4% | 2.4% |
Similar Demographics by 9th Grade
Demographics Similar to Cheyenne by 9th Grade
In terms of 9th grade, the demographic groups most similar to Cheyenne are Immigrants from Egypt (94.9%, a difference of 0.010%), Brazilian (94.9%, a difference of 0.010%), Iraqi (94.9%, a difference of 0.020%), Immigrants from Spain (94.9%, a difference of 0.020%), and Immigrants from Iraq (94.9%, a difference of 0.030%).
| Demographics | Rating | Rank | 9th Grade |
| Ute | 62.6 /100 | #166 | Good 95.0% |
| Immigrants | Brazil | 61.1 /100 | #167 | Good 95.0% |
| Chileans | 60.7 /100 | #168 | Good 95.0% |
| Spaniards | 59.6 /100 | #169 | Average 94.9% |
| Alsatians | 58.6 /100 | #170 | Average 94.9% |
| Colville | 58.5 /100 | #171 | Average 94.9% |
| Iraqis | 54.0 /100 | #172 | Average 94.9% |
| Cheyenne | 51.5 /100 | #173 | Average 94.9% |
| Immigrants | Egypt | 50.0 /100 | #174 | Average 94.9% |
| Brazilians | 49.8 /100 | #175 | Average 94.9% |
| Immigrants | Spain | 49.1 /100 | #176 | Average 94.9% |
| Immigrants | Iraq | 47.8 /100 | #177 | Average 94.9% |
| Immigrants | Poland | 46.7 /100 | #178 | Average 94.9% |
| Immigrants | Venezuela | 46.5 /100 | #179 | Average 94.9% |
| Immigrants | Uganda | 43.1 /100 | #180 | Average 94.8% |
Demographics Similar to Chippewa by 9th Grade
In terms of 9th grade, the demographic groups most similar to Chippewa are Czechoslovakian (96.1%, a difference of 0.0%), Slavic (96.1%, a difference of 0.010%), Iranian (96.1%, a difference of 0.010%), Ottawa (96.1%, a difference of 0.030%), and Alaska Native (96.1%, a difference of 0.030%).
| Demographics | Rating | Rank | 9th Grade |
| Bulgarians | 99.9 /100 | #35 | Exceptional 96.2% |
| Northern Europeans | 99.9 /100 | #36 | Exceptional 96.2% |
| Estonians | 99.9 /100 | #37 | Exceptional 96.1% |
| Immigrants | Scotland | 99.9 /100 | #38 | Exceptional 96.1% |
| Ottawa | 99.9 /100 | #39 | Exceptional 96.1% |
| Slavs | 99.9 /100 | #40 | Exceptional 96.1% |
| Czechoslovakians | 99.9 /100 | #41 | Exceptional 96.1% |
| Chippewa | 99.9 /100 | #42 | Exceptional 96.1% |
| Iranians | 99.9 /100 | #43 | Exceptional 96.1% |
| Alaska Natives | 99.9 /100 | #44 | Exceptional 96.1% |
| Crow | 99.9 /100 | #45 | Exceptional 96.1% |
| Immigrants | India | 99.9 /100 | #46 | Exceptional 96.1% |
| Russians | 99.9 /100 | #47 | Exceptional 96.0% |
| Australians | 99.9 /100 | #48 | Exceptional 96.0% |
| Greeks | 99.9 /100 | #49 | Exceptional 96.0% |