Cheyenne vs Chippewa In Labor Force | Age > 16
COMPARE
Cheyenne
Chippewa
In Labor Force | Age > 16
In Labor Force | Age > 16 Comparison
Cheyenne
Chippewa
62.0%
IN LABOR FORCE | AGE > 16
0.0/ 100
METRIC RATING
324th/ 347
METRIC RANK
63.1%
IN LABOR FORCE | AGE > 16
0.0/ 100
METRIC RATING
313th/ 347
METRIC RANK
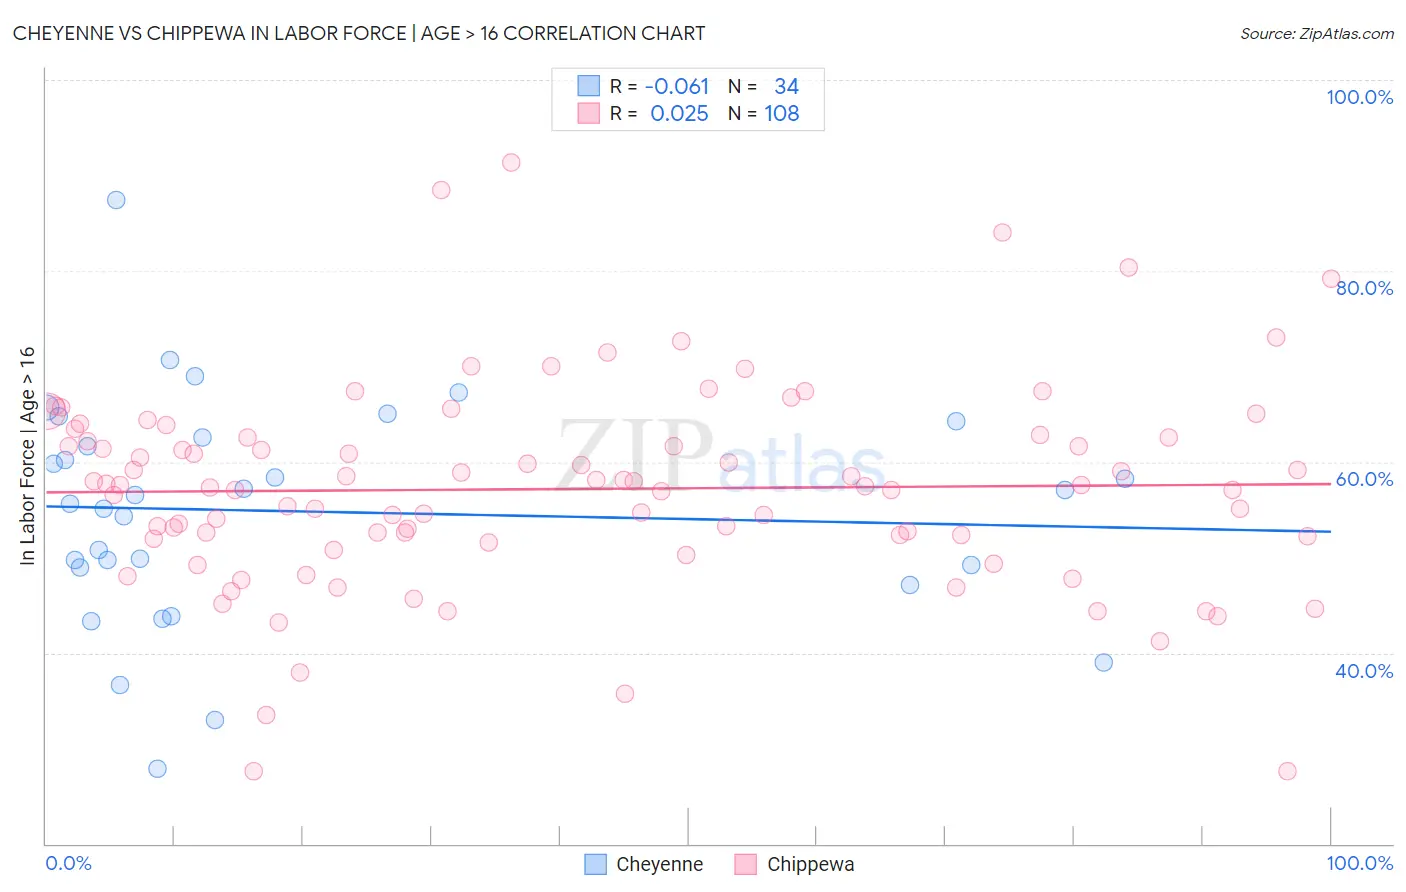
Cheyenne vs Chippewa In Labor Force | Age > 16 Correlation Chart
The statistical analysis conducted on geographies consisting of 80,712,848 people shows a slight negative correlation between the proportion of Cheyenne and labor force participation rate among population ages 16 and over in the United States with a correlation coefficient (R) of -0.061 and weighted average of 62.0%. Similarly, the statistical analysis conducted on geographies consisting of 215,053,820 people shows no correlation between the proportion of Chippewa and labor force participation rate among population ages 16 and over in the United States with a correlation coefficient (R) of 0.025 and weighted average of 63.1%, a difference of 1.8%.
In Labor Force | Age > 16 Correlation Summary
| Measurement | Cheyenne | Chippewa |
| Minimum | 27.9% | 27.6% |
| Maximum | 87.4% | 91.3% |
| Range | 59.5% | 63.7% |
| Mean | 54.8% | 57.2% |
| Median | 56.1% | 57.5% |
| Interquartile 25% (IQ1) | 49.0% | 52.1% |
| Interquartile 75% (IQ3) | 62.5% | 62.5% |
| Interquartile Range (IQR) | 13.5% | 10.4% |
| Standard Deviation (Sample) | 11.9% | 10.7% |
| Standard Deviation (Population) | 11.7% | 10.7% |
Demographics Similar to Cheyenne and Chippewa by In Labor Force | Age > 16
In terms of in labor force | age > 16, the demographic groups most similar to Cheyenne are Seminole (62.0%, a difference of 0.040%), Cherokee (61.9%, a difference of 0.050%), Ottawa (62.0%, a difference of 0.070%), American (62.1%, a difference of 0.22%), and Sioux (61.8%, a difference of 0.22%). Similarly, the demographic groups most similar to Chippewa are Yaqui (63.0%, a difference of 0.10%), Iroquois (63.2%, a difference of 0.13%), Blackfeet (63.2%, a difference of 0.19%), Shoshone (63.2%, a difference of 0.20%), and Scotch-Irish (63.3%, a difference of 0.27%).
| Demographics | Rating | Rank | In Labor Force | Age > 16 |
| Pennsylvania Germans | 0.0 /100 | #308 | Tragic 63.4% |
| Scotch-Irish | 0.0 /100 | #309 | Tragic 63.3% |
| Shoshone | 0.0 /100 | #310 | Tragic 63.2% |
| Blackfeet | 0.0 /100 | #311 | Tragic 63.2% |
| Iroquois | 0.0 /100 | #312 | Tragic 63.2% |
| Chippewa | 0.0 /100 | #313 | Tragic 63.1% |
| Yaqui | 0.0 /100 | #314 | Tragic 63.0% |
| Potawatomi | 0.0 /100 | #315 | Tragic 62.8% |
| Yup'ik | 0.0 /100 | #316 | Tragic 62.7% |
| Kiowa | 0.0 /100 | #317 | Tragic 62.4% |
| Chickasaw | 0.0 /100 | #318 | Tragic 62.3% |
| Arapaho | 0.0 /100 | #319 | Tragic 62.1% |
| Yakama | 0.0 /100 | #320 | Tragic 62.1% |
| Americans | 0.0 /100 | #321 | Tragic 62.1% |
| Ottawa | 0.0 /100 | #322 | Tragic 62.0% |
| Seminole | 0.0 /100 | #323 | Tragic 62.0% |
| Cheyenne | 0.0 /100 | #324 | Tragic 62.0% |
| Cherokee | 0.0 /100 | #325 | Tragic 61.9% |
| Sioux | 0.0 /100 | #326 | Tragic 61.8% |
| Cajuns | 0.0 /100 | #327 | Tragic 61.8% |
| Dutch West Indians | 0.0 /100 | #328 | Tragic 61.7% |