Immigrants from Western Europe vs Chippewa Female Poverty
COMPARE
Immigrants from Western Europe
Chippewa
Female Poverty
Female Poverty Comparison
Immigrants from Western Europe
Chippewa
12.8%
FEMALE POVERTY
86.6/ 100
METRIC RATING
133rd/ 347
METRIC RANK
16.7%
FEMALE POVERTY
0.0/ 100
METRIC RATING
302nd/ 347
METRIC RANK
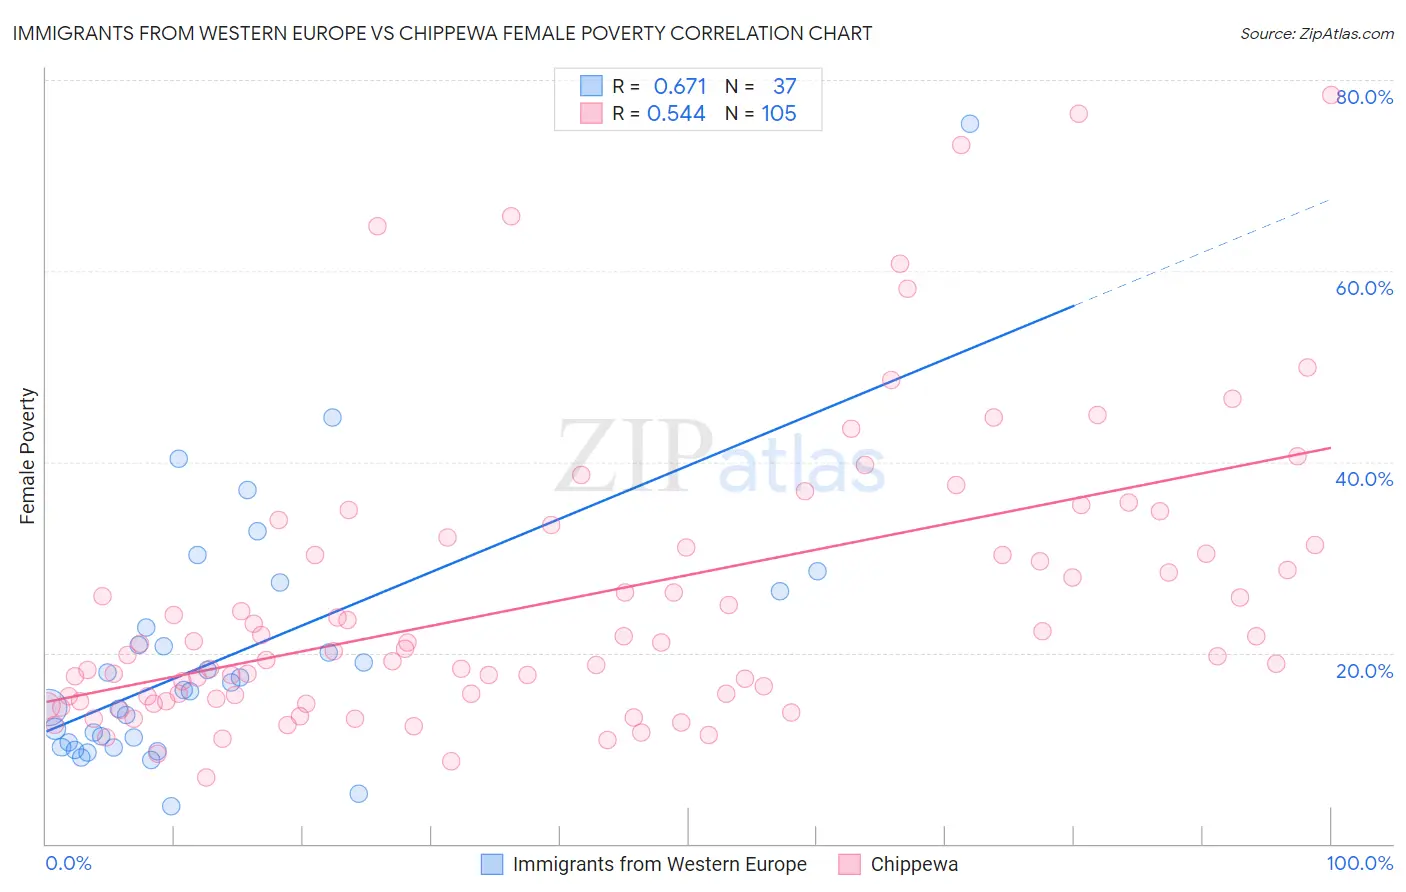
Immigrants from Western Europe vs Chippewa Female Poverty Correlation Chart
The statistical analysis conducted on geographies consisting of 493,604,679 people shows a significant positive correlation between the proportion of Immigrants from Western Europe and poverty level among females in the United States with a correlation coefficient (R) of 0.671 and weighted average of 12.8%. Similarly, the statistical analysis conducted on geographies consisting of 214,995,312 people shows a substantial positive correlation between the proportion of Chippewa and poverty level among females in the United States with a correlation coefficient (R) of 0.544 and weighted average of 16.7%, a difference of 30.1%.
Female Poverty Correlation Summary
| Measurement | Immigrants from Western Europe | Chippewa |
| Minimum | 4.0% | 7.0% |
| Maximum | 75.4% | 78.4% |
| Range | 71.4% | 71.4% |
| Mean | 19.6% | 25.6% |
| Median | 16.1% | 20.4% |
| Interquartile 25% (IQ1) | 10.4% | 15.3% |
| Interquartile 75% (IQ3) | 24.5% | 31.2% |
| Interquartile Range (IQR) | 14.2% | 15.8% |
| Standard Deviation (Sample) | 13.5% | 15.1% |
| Standard Deviation (Population) | 13.4% | 15.0% |
Similar Demographics by Female Poverty
Demographics Similar to Immigrants from Western Europe by Female Poverty
In terms of female poverty, the demographic groups most similar to Immigrants from Western Europe are Immigrants from Jordan (12.8%, a difference of 0.060%), Immigrants from Argentina (12.8%, a difference of 0.070%), Immigrants from Vietnam (12.8%, a difference of 0.11%), Immigrants from Switzerland (12.9%, a difference of 0.16%), and French (12.9%, a difference of 0.22%).
| Demographics | Rating | Rank | Female Poverty |
| Immigrants | Ukraine | 88.8 /100 | #126 | Excellent 12.8% |
| South Africans | 88.4 /100 | #127 | Excellent 12.8% |
| Immigrants | Belarus | 88.2 /100 | #128 | Excellent 12.8% |
| Immigrants | Brazil | 87.9 /100 | #129 | Excellent 12.8% |
| Immigrants | Vietnam | 87.1 /100 | #130 | Excellent 12.8% |
| Immigrants | Argentina | 87.0 /100 | #131 | Excellent 12.8% |
| Immigrants | Jordan | 86.9 /100 | #132 | Excellent 12.8% |
| Immigrants | Western Europe | 86.6 /100 | #133 | Excellent 12.8% |
| Immigrants | Switzerland | 85.8 /100 | #134 | Excellent 12.9% |
| French | 85.6 /100 | #135 | Excellent 12.9% |
| Peruvians | 85.2 /100 | #136 | Excellent 12.9% |
| Chileans | 84.7 /100 | #137 | Excellent 12.9% |
| Immigrants | France | 83.6 /100 | #138 | Excellent 12.9% |
| Basques | 83.1 /100 | #139 | Excellent 12.9% |
| Pakistanis | 83.0 /100 | #140 | Excellent 12.9% |
Demographics Similar to Chippewa by Female Poverty
In terms of female poverty, the demographic groups most similar to Chippewa are Guatemalan (16.7%, a difference of 0.030%), Bahamian (16.6%, a difference of 0.36%), Hispanic or Latino (16.6%, a difference of 0.40%), Choctaw (16.8%, a difference of 0.61%), and Immigrants from Central America (16.8%, a difference of 0.67%).
| Demographics | Rating | Rank | Female Poverty |
| Senegalese | 0.0 /100 | #295 | Tragic 16.5% |
| Immigrants | Senegal | 0.0 /100 | #296 | Tragic 16.5% |
| Mexicans | 0.0 /100 | #297 | Tragic 16.5% |
| Somalis | 0.0 /100 | #298 | Tragic 16.6% |
| Hispanics or Latinos | 0.0 /100 | #299 | Tragic 16.6% |
| Bahamians | 0.0 /100 | #300 | Tragic 16.6% |
| Guatemalans | 0.0 /100 | #301 | Tragic 16.7% |
| Chippewa | 0.0 /100 | #302 | Tragic 16.7% |
| Choctaw | 0.0 /100 | #303 | Tragic 16.8% |
| Immigrants | Central America | 0.0 /100 | #304 | Tragic 16.8% |
| Immigrants | Grenada | 0.0 /100 | #305 | Tragic 16.8% |
| Immigrants | Caribbean | 0.0 /100 | #306 | Tragic 16.9% |
| Seminole | 0.0 /100 | #307 | Tragic 16.9% |
| Africans | 0.0 /100 | #308 | Tragic 16.9% |
| Immigrants | Mexico | 0.0 /100 | #309 | Tragic 17.0% |