Cherokee vs Immigrants from Poland Married-Couple Family Poverty
COMPARE
Cherokee
Immigrants from Poland
Married-Couple Family Poverty
Married-Couple Family Poverty Comparison
Cherokee
Immigrants from Poland
5.8%
MARRIED-COUPLE FAMILY POVERTY
2.7/ 100
METRIC RATING
238th/ 347
METRIC RANK
4.6%
MARRIED-COUPLE FAMILY POVERTY
98.3/ 100
METRIC RATING
96th/ 347
METRIC RANK
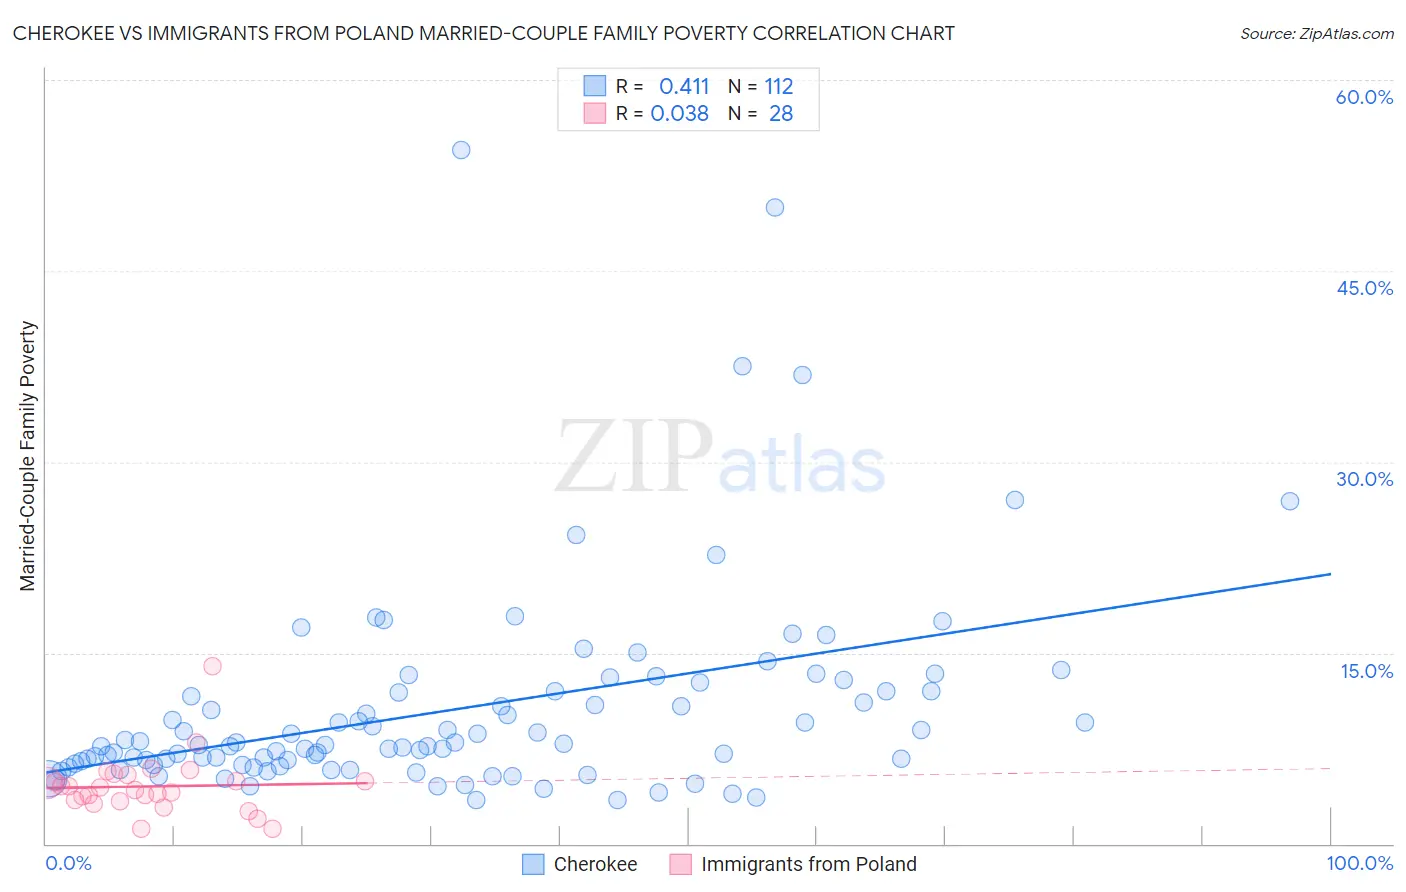
Cherokee vs Immigrants from Poland Married-Couple Family Poverty Correlation Chart
The statistical analysis conducted on geographies consisting of 487,541,023 people shows a moderate positive correlation between the proportion of Cherokee and poverty level among married-couple families in the United States with a correlation coefficient (R) of 0.411 and weighted average of 5.8%. Similarly, the statistical analysis conducted on geographies consisting of 302,218,163 people shows no correlation between the proportion of Immigrants from Poland and poverty level among married-couple families in the United States with a correlation coefficient (R) of 0.038 and weighted average of 4.6%, a difference of 25.1%.
Married-Couple Family Poverty Correlation Summary
| Measurement | Cherokee | Immigrants from Poland |
| Minimum | 3.4% | 1.2% |
| Maximum | 54.5% | 13.9% |
| Range | 51.1% | 12.8% |
| Mean | 10.6% | 4.5% |
| Median | 7.7% | 4.3% |
| Interquartile 25% (IQ1) | 6.2% | 3.4% |
| Interquartile 75% (IQ3) | 12.0% | 5.2% |
| Interquartile Range (IQR) | 5.8% | 1.8% |
| Standard Deviation (Sample) | 8.2% | 2.4% |
| Standard Deviation (Population) | 8.2% | 2.3% |
Similar Demographics by Married-Couple Family Poverty
Demographics Similar to Cherokee by Married-Couple Family Poverty
In terms of married-couple family poverty, the demographic groups most similar to Cherokee are Venezuelan (5.8%, a difference of 0.020%), Fijian (5.8%, a difference of 0.19%), Immigrants from Panama (5.8%, a difference of 0.22%), Immigrants from Western Africa (5.8%, a difference of 0.31%), and Immigrants from South America (5.7%, a difference of 0.38%).
| Demographics | Rating | Rank | Married-Couple Family Poverty |
| Immigrants | Iraq | 4.4 /100 | #231 | Tragic 5.7% |
| Immigrants | Laos | 4.4 /100 | #232 | Tragic 5.7% |
| Immigrants | Colombia | 3.7 /100 | #233 | Tragic 5.7% |
| Immigrants | Uruguay | 3.7 /100 | #234 | Tragic 5.7% |
| Immigrants | Sudan | 3.5 /100 | #235 | Tragic 5.7% |
| Ghanaians | 3.3 /100 | #236 | Tragic 5.7% |
| Immigrants | South America | 3.1 /100 | #237 | Tragic 5.7% |
| Cherokee | 2.7 /100 | #238 | Tragic 5.8% |
| Venezuelans | 2.7 /100 | #239 | Tragic 5.8% |
| Fijians | 2.5 /100 | #240 | Tragic 5.8% |
| Immigrants | Panama | 2.5 /100 | #241 | Tragic 5.8% |
| Immigrants | Western Africa | 2.4 /100 | #242 | Tragic 5.8% |
| Somalis | 2.3 /100 | #243 | Tragic 5.8% |
| Chickasaw | 2.3 /100 | #244 | Tragic 5.8% |
| Immigrants | Afghanistan | 2.1 /100 | #245 | Tragic 5.8% |
Demographics Similar to Immigrants from Poland by Married-Couple Family Poverty
In terms of married-couple family poverty, the demographic groups most similar to Immigrants from Poland are Immigrants from Belgium (4.6%, a difference of 0.050%), Portuguese (4.6%, a difference of 0.080%), Immigrants from Italy (4.6%, a difference of 0.12%), Korean (4.6%, a difference of 0.17%), and Immigrants from Norway (4.6%, a difference of 0.35%).
| Demographics | Rating | Rank | Married-Couple Family Poverty |
| Immigrants | Czechoslovakia | 98.5 /100 | #89 | Exceptional 4.6% |
| Immigrants | Switzerland | 98.5 /100 | #90 | Exceptional 4.6% |
| Basques | 98.5 /100 | #91 | Exceptional 4.6% |
| Immigrants | Norway | 98.4 /100 | #92 | Exceptional 4.6% |
| Koreans | 98.3 /100 | #93 | Exceptional 4.6% |
| Immigrants | Italy | 98.3 /100 | #94 | Exceptional 4.6% |
| Portuguese | 98.3 /100 | #95 | Exceptional 4.6% |
| Immigrants | Poland | 98.3 /100 | #96 | Exceptional 4.6% |
| Immigrants | Belgium | 98.2 /100 | #97 | Exceptional 4.6% |
| Native Hawaiians | 98.0 /100 | #98 | Exceptional 4.6% |
| Immigrants | Europe | 97.9 /100 | #99 | Exceptional 4.6% |
| Immigrants | Western Europe | 97.9 /100 | #100 | Exceptional 4.6% |
| Yugoslavians | 97.8 /100 | #101 | Exceptional 4.6% |
| Asians | 97.6 /100 | #102 | Exceptional 4.7% |
| Immigrants | Romania | 97.3 /100 | #103 | Exceptional 4.7% |