Cherokee vs Brazilian Married-Couple Family Poverty
COMPARE
Cherokee
Brazilian
Married-Couple Family Poverty
Married-Couple Family Poverty Comparison
Cherokee
Brazilians
5.8%
MARRIED-COUPLE FAMILY POVERTY
2.7/ 100
METRIC RATING
238th/ 347
METRIC RANK
5.0%
MARRIED-COUPLE FAMILY POVERTY
78.3/ 100
METRIC RATING
150th/ 347
METRIC RANK
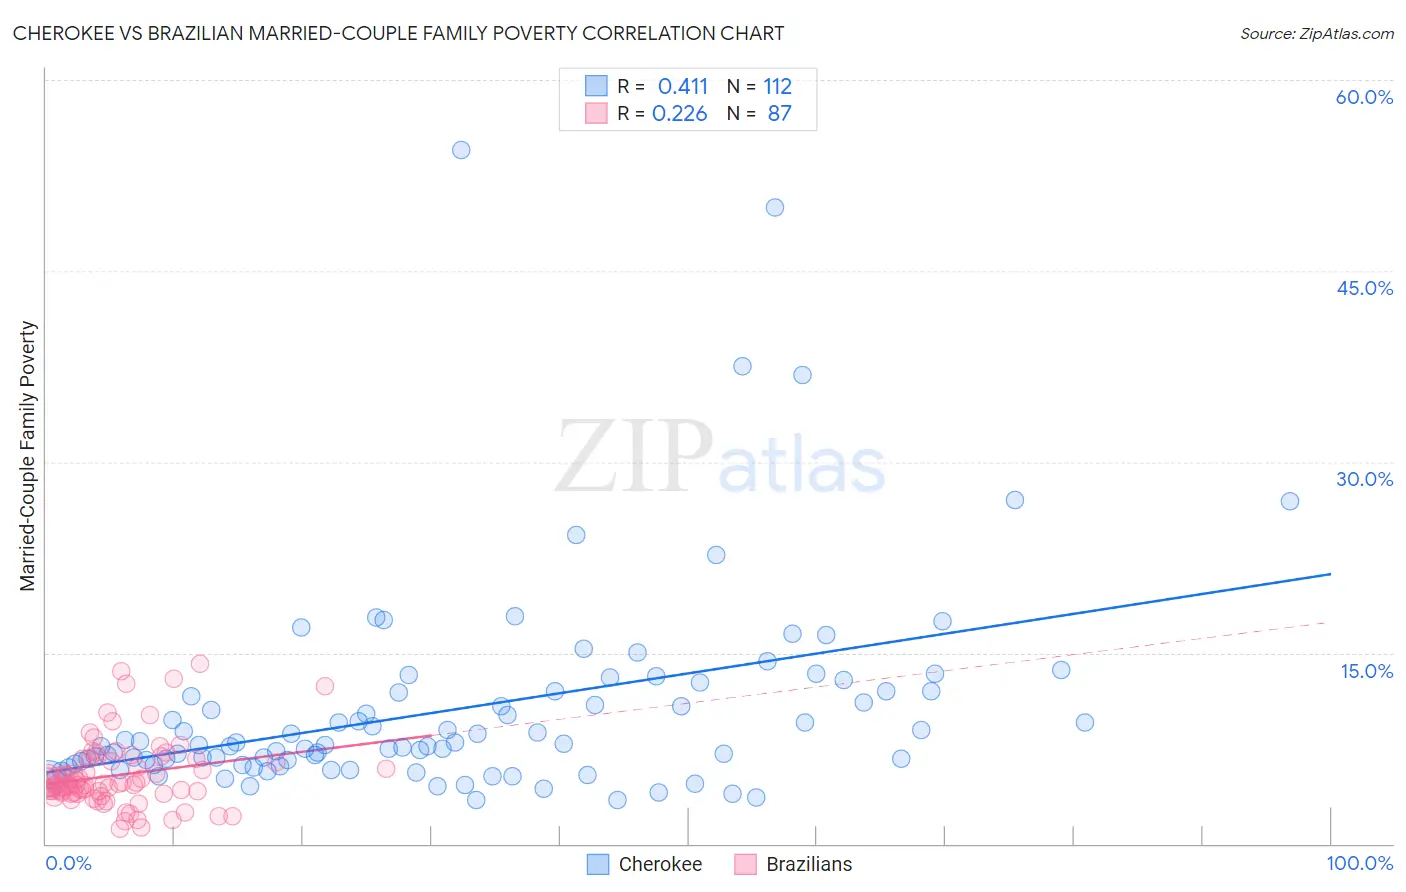
Cherokee vs Brazilian Married-Couple Family Poverty Correlation Chart
The statistical analysis conducted on geographies consisting of 487,541,023 people shows a moderate positive correlation between the proportion of Cherokee and poverty level among married-couple families in the United States with a correlation coefficient (R) of 0.411 and weighted average of 5.8%. Similarly, the statistical analysis conducted on geographies consisting of 321,555,687 people shows a weak positive correlation between the proportion of Brazilians and poverty level among married-couple families in the United States with a correlation coefficient (R) of 0.226 and weighted average of 5.0%, a difference of 14.7%.
Married-Couple Family Poverty Correlation Summary
| Measurement | Cherokee | Brazilian |
| Minimum | 3.4% | 1.1% |
| Maximum | 54.5% | 14.2% |
| Range | 51.1% | 13.0% |
| Mean | 10.6% | 5.4% |
| Median | 7.7% | 4.6% |
| Interquartile 25% (IQ1) | 6.2% | 4.0% |
| Interquartile 75% (IQ3) | 12.0% | 6.6% |
| Interquartile Range (IQR) | 5.8% | 2.6% |
| Standard Deviation (Sample) | 8.2% | 2.7% |
| Standard Deviation (Population) | 8.2% | 2.7% |
Similar Demographics by Married-Couple Family Poverty
Demographics Similar to Cherokee by Married-Couple Family Poverty
In terms of married-couple family poverty, the demographic groups most similar to Cherokee are Venezuelan (5.8%, a difference of 0.020%), Fijian (5.8%, a difference of 0.19%), Immigrants from Panama (5.8%, a difference of 0.22%), Immigrants from Western Africa (5.8%, a difference of 0.31%), and Immigrants from South America (5.7%, a difference of 0.38%).
| Demographics | Rating | Rank | Married-Couple Family Poverty |
| Immigrants | Iraq | 4.4 /100 | #231 | Tragic 5.7% |
| Immigrants | Laos | 4.4 /100 | #232 | Tragic 5.7% |
| Immigrants | Colombia | 3.7 /100 | #233 | Tragic 5.7% |
| Immigrants | Uruguay | 3.7 /100 | #234 | Tragic 5.7% |
| Immigrants | Sudan | 3.5 /100 | #235 | Tragic 5.7% |
| Ghanaians | 3.3 /100 | #236 | Tragic 5.7% |
| Immigrants | South America | 3.1 /100 | #237 | Tragic 5.7% |
| Cherokee | 2.7 /100 | #238 | Tragic 5.8% |
| Venezuelans | 2.7 /100 | #239 | Tragic 5.8% |
| Fijians | 2.5 /100 | #240 | Tragic 5.8% |
| Immigrants | Panama | 2.5 /100 | #241 | Tragic 5.8% |
| Immigrants | Western Africa | 2.4 /100 | #242 | Tragic 5.8% |
| Somalis | 2.3 /100 | #243 | Tragic 5.8% |
| Chickasaw | 2.3 /100 | #244 | Tragic 5.8% |
| Immigrants | Afghanistan | 2.1 /100 | #245 | Tragic 5.8% |
Demographics Similar to Brazilians by Married-Couple Family Poverty
In terms of married-couple family poverty, the demographic groups most similar to Brazilians are Immigrants from Oceania (5.0%, a difference of 0.050%), Syrian (5.0%, a difference of 0.080%), Immigrants from Russia (5.0%, a difference of 0.080%), Immigrants from Cameroon (5.0%, a difference of 0.17%), and Albanian (5.0%, a difference of 0.19%).
| Demographics | Rating | Rank | Married-Couple Family Poverty |
| Immigrants | Egypt | 83.4 /100 | #143 | Excellent 5.0% |
| Hmong | 83.2 /100 | #144 | Excellent 5.0% |
| Immigrants | Spain | 79.9 /100 | #145 | Good 5.0% |
| Mongolians | 79.8 /100 | #146 | Good 5.0% |
| Syrians | 78.7 /100 | #147 | Good 5.0% |
| Immigrants | Russia | 78.7 /100 | #148 | Good 5.0% |
| Immigrants | Oceania | 78.6 /100 | #149 | Good 5.0% |
| Brazilians | 78.3 /100 | #150 | Good 5.0% |
| Immigrants | Cameroon | 77.3 /100 | #151 | Good 5.0% |
| Albanians | 77.2 /100 | #152 | Good 5.0% |
| Immigrants | Kuwait | 76.3 /100 | #153 | Good 5.0% |
| Delaware | 73.7 /100 | #154 | Good 5.1% |
| Immigrants | Ethiopia | 72.4 /100 | #155 | Good 5.1% |
| Sri Lankans | 72.2 /100 | #156 | Good 5.1% |
| Argentineans | 70.7 /100 | #157 | Good 5.1% |