Cherokee vs Armenian Married-Couple Family Poverty
COMPARE
Cherokee
Armenian
Married-Couple Family Poverty
Married-Couple Family Poverty Comparison
Cherokee
Armenians
5.8%
MARRIED-COUPLE FAMILY POVERTY
2.7/ 100
METRIC RATING
238th/ 347
METRIC RANK
5.5%
MARRIED-COUPLE FAMILY POVERTY
12.8/ 100
METRIC RATING
215th/ 347
METRIC RANK
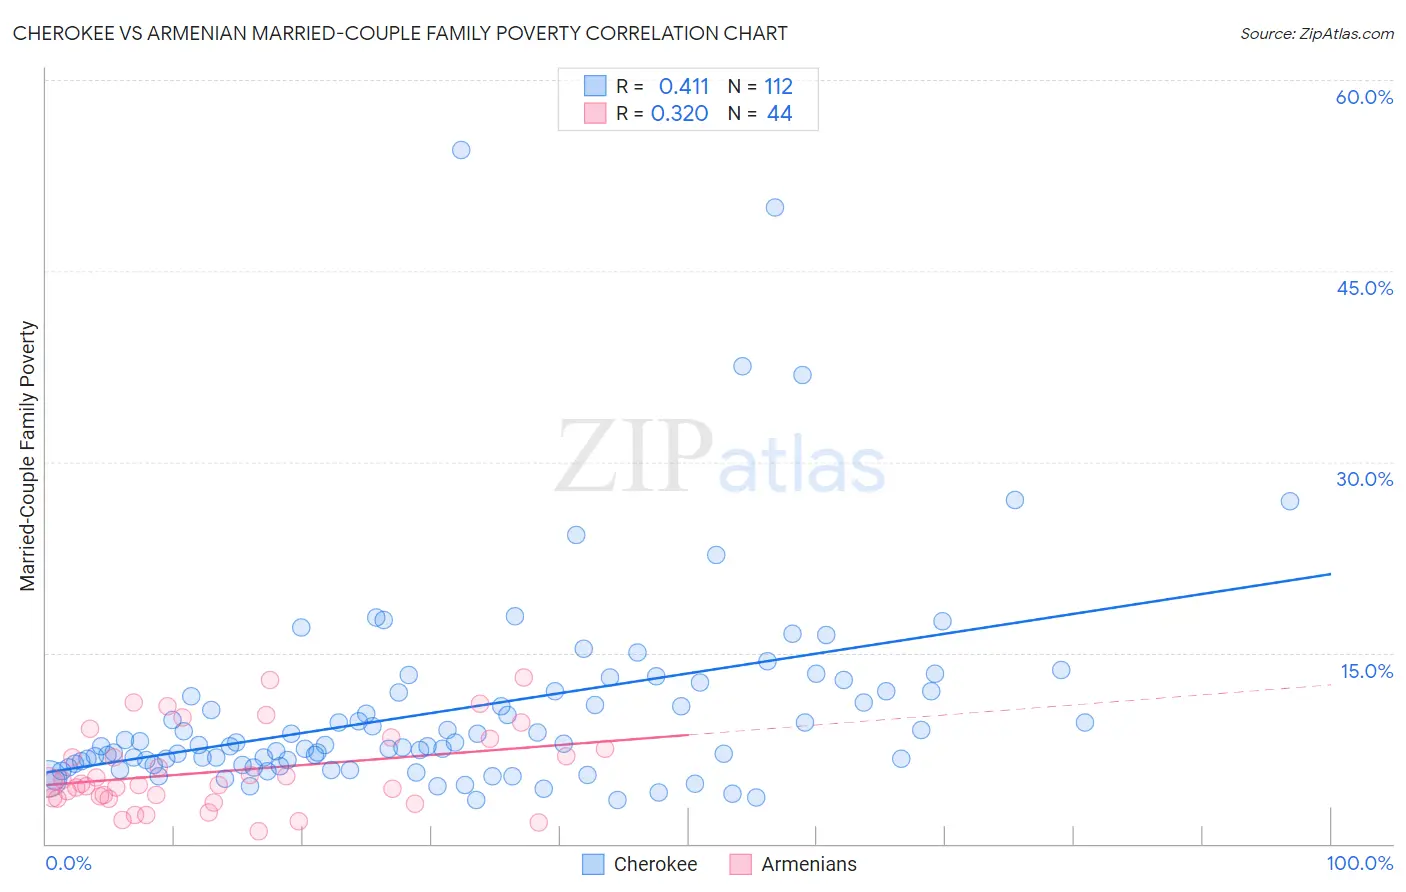
Cherokee vs Armenian Married-Couple Family Poverty Correlation Chart
The statistical analysis conducted on geographies consisting of 487,541,023 people shows a moderate positive correlation between the proportion of Cherokee and poverty level among married-couple families in the United States with a correlation coefficient (R) of 0.411 and weighted average of 5.8%. Similarly, the statistical analysis conducted on geographies consisting of 308,319,420 people shows a mild positive correlation between the proportion of Armenians and poverty level among married-couple families in the United States with a correlation coefficient (R) of 0.320 and weighted average of 5.5%, a difference of 4.6%.
Married-Couple Family Poverty Correlation Summary
| Measurement | Cherokee | Armenian |
| Minimum | 3.4% | 0.96% |
| Maximum | 54.5% | 13.1% |
| Range | 51.1% | 12.1% |
| Mean | 10.6% | 5.7% |
| Median | 7.7% | 4.7% |
| Interquartile 25% (IQ1) | 6.2% | 3.6% |
| Interquartile 75% (IQ3) | 12.0% | 7.9% |
| Interquartile Range (IQR) | 5.8% | 4.2% |
| Standard Deviation (Sample) | 8.2% | 3.1% |
| Standard Deviation (Population) | 8.2% | 3.1% |
Similar Demographics by Married-Couple Family Poverty
Demographics Similar to Cherokee by Married-Couple Family Poverty
In terms of married-couple family poverty, the demographic groups most similar to Cherokee are Venezuelan (5.8%, a difference of 0.020%), Fijian (5.8%, a difference of 0.19%), Immigrants from Panama (5.8%, a difference of 0.22%), Immigrants from Western Africa (5.8%, a difference of 0.31%), and Immigrants from South America (5.7%, a difference of 0.38%).
| Demographics | Rating | Rank | Married-Couple Family Poverty |
| Immigrants | Iraq | 4.4 /100 | #231 | Tragic 5.7% |
| Immigrants | Laos | 4.4 /100 | #232 | Tragic 5.7% |
| Immigrants | Colombia | 3.7 /100 | #233 | Tragic 5.7% |
| Immigrants | Uruguay | 3.7 /100 | #234 | Tragic 5.7% |
| Immigrants | Sudan | 3.5 /100 | #235 | Tragic 5.7% |
| Ghanaians | 3.3 /100 | #236 | Tragic 5.7% |
| Immigrants | South America | 3.1 /100 | #237 | Tragic 5.7% |
| Cherokee | 2.7 /100 | #238 | Tragic 5.8% |
| Venezuelans | 2.7 /100 | #239 | Tragic 5.8% |
| Fijians | 2.5 /100 | #240 | Tragic 5.8% |
| Immigrants | Panama | 2.5 /100 | #241 | Tragic 5.8% |
| Immigrants | Western Africa | 2.4 /100 | #242 | Tragic 5.8% |
| Somalis | 2.3 /100 | #243 | Tragic 5.8% |
| Chickasaw | 2.3 /100 | #244 | Tragic 5.8% |
| Immigrants | Afghanistan | 2.1 /100 | #245 | Tragic 5.8% |
Demographics Similar to Armenians by Married-Couple Family Poverty
In terms of married-couple family poverty, the demographic groups most similar to Armenians are Iroquois (5.5%, a difference of 0.060%), Immigrants from Liberia (5.5%, a difference of 0.11%), Potawatomi (5.5%, a difference of 0.12%), Immigrants from Thailand (5.5%, a difference of 0.29%), and Nigerian (5.5%, a difference of 0.35%).
| Demographics | Rating | Rank | Married-Couple Family Poverty |
| French American Indians | 16.1 /100 | #208 | Poor 5.5% |
| Immigrants | Syria | 15.4 /100 | #209 | Poor 5.5% |
| Immigrants | Micronesia | 14.4 /100 | #210 | Poor 5.5% |
| Nigerians | 14.3 /100 | #211 | Poor 5.5% |
| Immigrants | Thailand | 14.0 /100 | #212 | Poor 5.5% |
| Immigrants | Liberia | 13.3 /100 | #213 | Poor 5.5% |
| Iroquois | 13.1 /100 | #214 | Poor 5.5% |
| Armenians | 12.8 /100 | #215 | Poor 5.5% |
| Potawatomi | 12.4 /100 | #216 | Poor 5.5% |
| Immigrants | Nigeria | 11.3 /100 | #217 | Poor 5.5% |
| Afghans | 11.2 /100 | #218 | Poor 5.5% |
| Japanese | 9.8 /100 | #219 | Tragic 5.6% |
| Colombians | 9.2 /100 | #220 | Tragic 5.6% |
| Panamanians | 9.2 /100 | #221 | Tragic 5.6% |
| Cajuns | 6.9 /100 | #222 | Tragic 5.6% |