Cherokee vs Brazilian Median Female Earnings
COMPARE
Cherokee
Brazilian
Median Female Earnings
Median Female Earnings Comparison
Cherokee
Brazilians
$34,742
MEDIAN FEMALE EARNINGS
0.0/ 100
METRIC RATING
316th/ 347
METRIC RANK
$40,483
MEDIAN FEMALE EARNINGS
83.6/ 100
METRIC RATING
145th/ 347
METRIC RANK
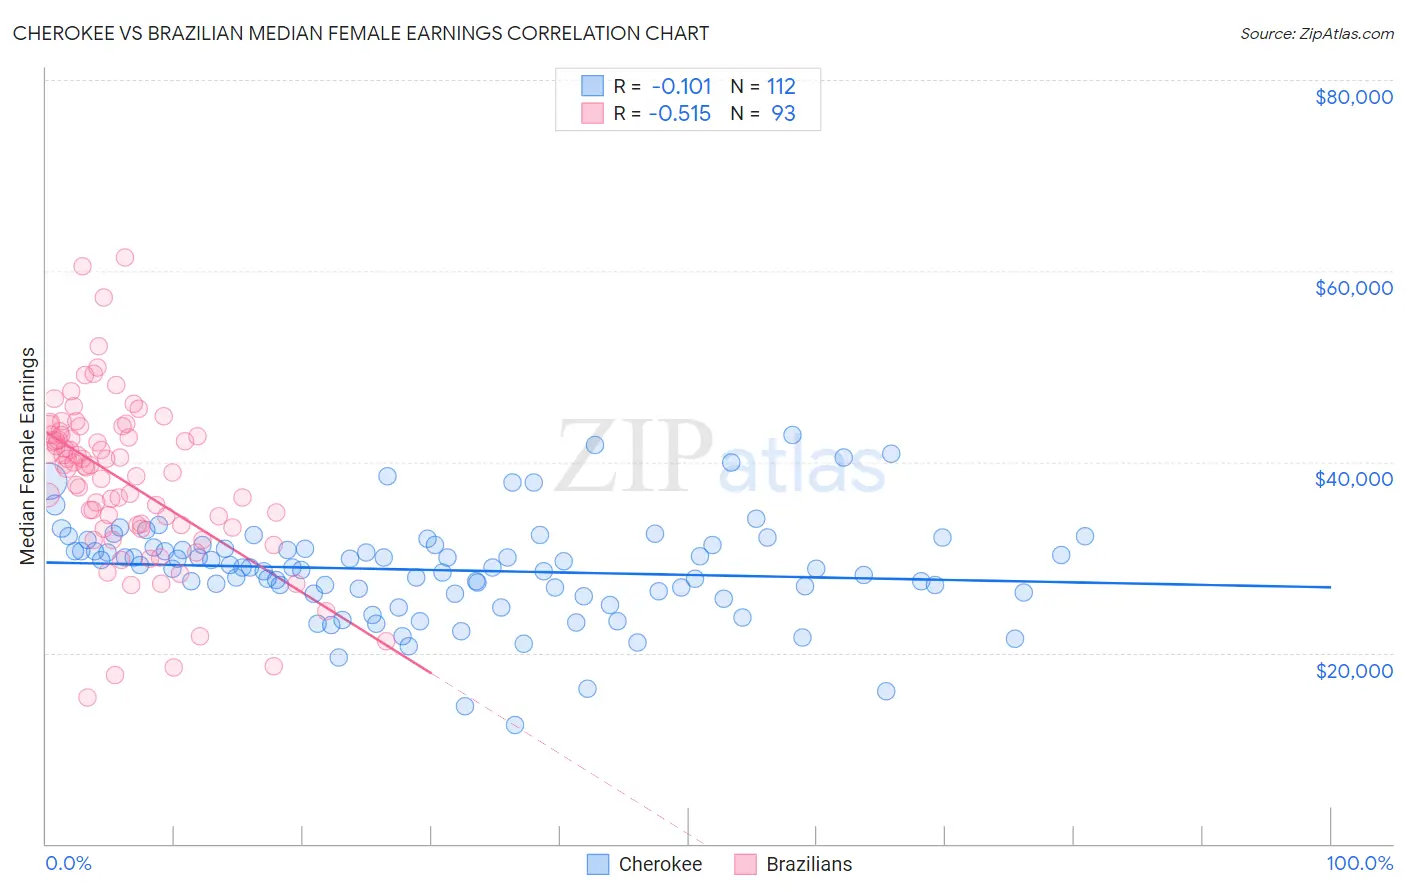
Cherokee vs Brazilian Median Female Earnings Correlation Chart
The statistical analysis conducted on geographies consisting of 492,961,195 people shows a poor negative correlation between the proportion of Cherokee and median female earnings in the United States with a correlation coefficient (R) of -0.101 and weighted average of $34,742. Similarly, the statistical analysis conducted on geographies consisting of 323,890,405 people shows a substantial negative correlation between the proportion of Brazilians and median female earnings in the United States with a correlation coefficient (R) of -0.515 and weighted average of $40,483, a difference of 16.5%.
Median Female Earnings Correlation Summary
| Measurement | Cherokee | Brazilian |
| Minimum | $12,396 | $15,384 |
| Maximum | $42,750 | $61,398 |
| Range | $30,354 | $46,014 |
| Mean | $28,662 | $38,053 |
| Median | $28,960 | $39,528 |
| Interquartile 25% (IQ1) | $26,268 | $33,268 |
| Interquartile 75% (IQ3) | $31,156 | $42,843 |
| Interquartile Range (IQR) | $4,888 | $9,575 |
| Standard Deviation (Sample) | $5,298 | $8,528 |
| Standard Deviation (Population) | $5,275 | $8,482 |
Similar Demographics by Median Female Earnings
Demographics Similar to Cherokee by Median Female Earnings
In terms of median female earnings, the demographic groups most similar to Cherokee are Potawatomi ($34,739, a difference of 0.010%), Immigrants from Yemen ($34,693, a difference of 0.14%), Pennsylvania German ($34,802, a difference of 0.17%), Shoshone ($34,677, a difference of 0.19%), and Immigrants from Honduras ($34,647, a difference of 0.27%).
| Demographics | Rating | Rank | Median Female Earnings |
| Hondurans | 0.0 /100 | #309 | Tragic $35,013 |
| Chippewa | 0.0 /100 | #310 | Tragic $35,003 |
| Ute | 0.0 /100 | #311 | Tragic $34,960 |
| Yaqui | 0.0 /100 | #312 | Tragic $34,943 |
| Cubans | 0.0 /100 | #313 | Tragic $34,942 |
| Apache | 0.0 /100 | #314 | Tragic $34,895 |
| Pennsylvania Germans | 0.0 /100 | #315 | Tragic $34,802 |
| Cherokee | 0.0 /100 | #316 | Tragic $34,742 |
| Potawatomi | 0.0 /100 | #317 | Tragic $34,739 |
| Immigrants | Yemen | 0.0 /100 | #318 | Tragic $34,693 |
| Shoshone | 0.0 /100 | #319 | Tragic $34,677 |
| Immigrants | Honduras | 0.0 /100 | #320 | Tragic $34,647 |
| Hispanics or Latinos | 0.0 /100 | #321 | Tragic $34,421 |
| Chickasaw | 0.0 /100 | #322 | Tragic $34,414 |
| Seminole | 0.0 /100 | #323 | Tragic $34,385 |
Demographics Similar to Brazilians by Median Female Earnings
In terms of median female earnings, the demographic groups most similar to Brazilians are Immigrants from North Macedonia ($40,488, a difference of 0.010%), Northern European ($40,491, a difference of 0.020%), Sri Lankan ($40,496, a difference of 0.030%), Immigrants from Syria ($40,499, a difference of 0.040%), and Ghanaian ($40,429, a difference of 0.13%).
| Demographics | Rating | Rank | Median Female Earnings |
| Taiwanese | 86.1 /100 | #138 | Excellent $40,576 |
| Immigrants | South Eastern Asia | 85.7 /100 | #139 | Excellent $40,558 |
| Serbians | 85.2 /100 | #140 | Excellent $40,539 |
| Immigrants | Syria | 84.1 /100 | #141 | Excellent $40,499 |
| Sri Lankans | 84.0 /100 | #142 | Excellent $40,496 |
| Northern Europeans | 83.9 /100 | #143 | Excellent $40,491 |
| Immigrants | North Macedonia | 83.8 /100 | #144 | Excellent $40,488 |
| Brazilians | 83.6 /100 | #145 | Excellent $40,483 |
| Ghanaians | 82.1 /100 | #146 | Excellent $40,429 |
| Vietnamese | 80.4 /100 | #147 | Excellent $40,377 |
| Poles | 80.2 /100 | #148 | Excellent $40,371 |
| Immigrants | Cameroon | 79.7 /100 | #149 | Good $40,354 |
| Immigrants | Chile | 79.6 /100 | #150 | Good $40,353 |
| Immigrants | Armenia | 79.2 /100 | #151 | Good $40,340 |
| West Indians | 78.4 /100 | #152 | Good $40,317 |