Immigrants from Honduras vs Tlingit-Haida Married-Couple Family Poverty
COMPARE
Immigrants from Honduras
Tlingit-Haida
Married-Couple Family Poverty
Married-Couple Family Poverty Comparison
Immigrants from Honduras
Tlingit-Haida
7.3%
MARRIED-COUPLE FAMILY POVERTY
0.0/ 100
METRIC RATING
322nd/ 347
METRIC RANK
4.4%
MARRIED-COUPLE FAMILY POVERTY
99.6/ 100
METRIC RATING
60th/ 347
METRIC RANK
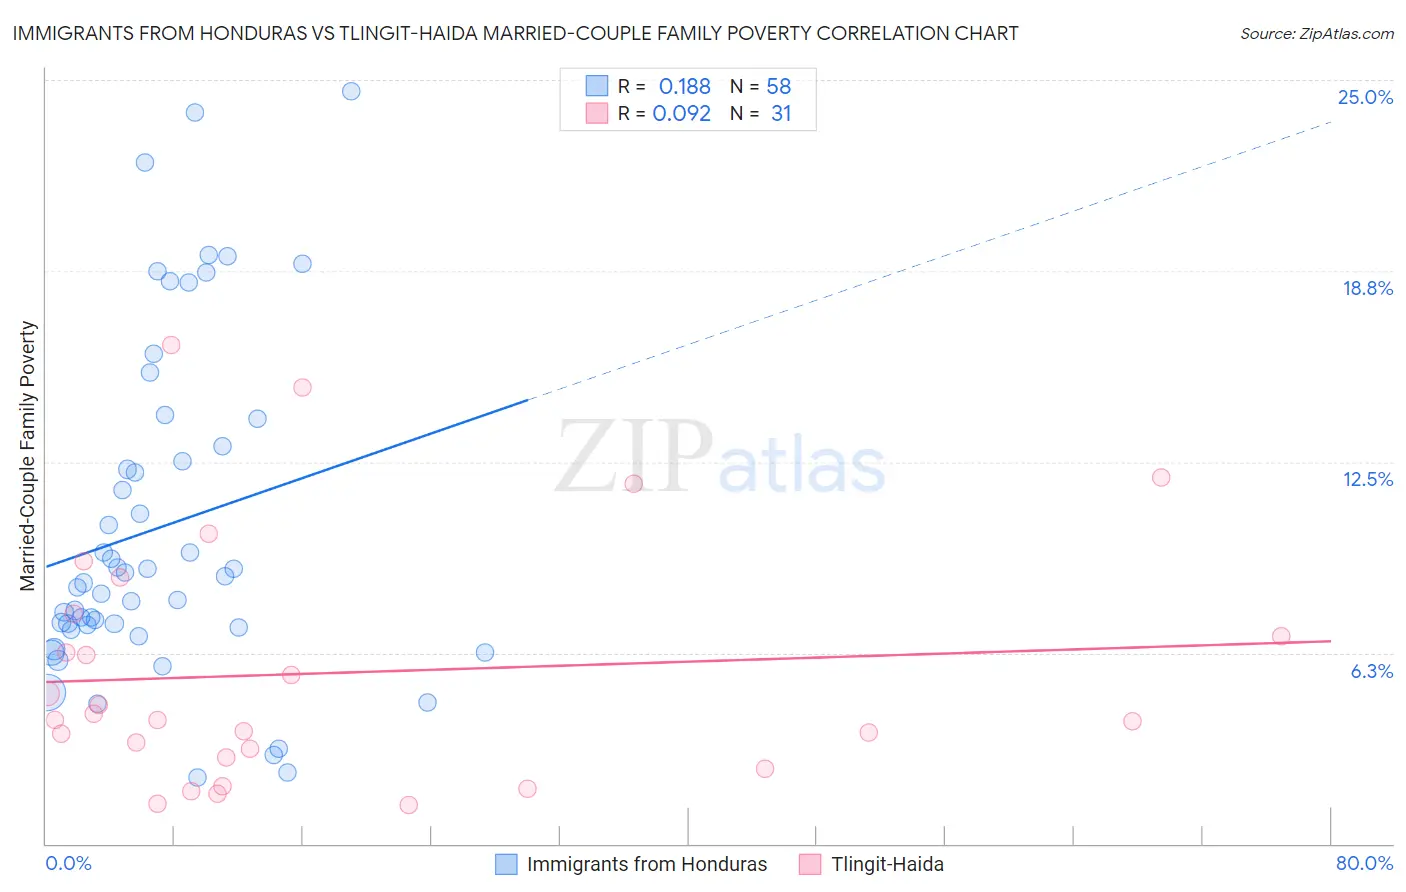
Immigrants from Honduras vs Tlingit-Haida Married-Couple Family Poverty Correlation Chart
The statistical analysis conducted on geographies consisting of 321,084,315 people shows a poor positive correlation between the proportion of Immigrants from Honduras and poverty level among married-couple families in the United States with a correlation coefficient (R) of 0.188 and weighted average of 7.3%. Similarly, the statistical analysis conducted on geographies consisting of 60,624,230 people shows a slight positive correlation between the proportion of Tlingit-Haida and poverty level among married-couple families in the United States with a correlation coefficient (R) of 0.092 and weighted average of 4.4%, a difference of 67.8%.
Married-Couple Family Poverty Correlation Summary
| Measurement | Immigrants from Honduras | Tlingit-Haida |
| Minimum | 2.2% | 1.3% |
| Maximum | 24.6% | 16.3% |
| Range | 22.4% | 15.1% |
| Mean | 10.4% | 5.6% |
| Median | 8.6% | 4.1% |
| Interquartile 25% (IQ1) | 7.1% | 2.8% |
| Interquartile 75% (IQ3) | 13.0% | 7.5% |
| Interquartile Range (IQR) | 5.9% | 4.7% |
| Standard Deviation (Sample) | 5.5% | 4.0% |
| Standard Deviation (Population) | 5.4% | 3.9% |
Similar Demographics by Married-Couple Family Poverty
Demographics Similar to Immigrants from Honduras by Married-Couple Family Poverty
In terms of married-couple family poverty, the demographic groups most similar to Immigrants from Honduras are Immigrants from Caribbean (7.3%, a difference of 0.030%), Immigrants from Grenada (7.3%, a difference of 0.79%), Vietnamese (7.4%, a difference of 1.1%), Immigrants from Central America (7.4%, a difference of 1.1%), and Immigrants from Cuba (7.5%, a difference of 1.7%).
| Demographics | Rating | Rank | Married-Couple Family Poverty |
| Inupiat | 0.0 /100 | #315 | Tragic 7.1% |
| Hondurans | 0.0 /100 | #316 | Tragic 7.2% |
| Mexicans | 0.0 /100 | #317 | Tragic 7.2% |
| Immigrants | Guatemala | 0.0 /100 | #318 | Tragic 7.2% |
| Immigrants | Latin America | 0.0 /100 | #319 | Tragic 7.2% |
| Immigrants | Grenada | 0.0 /100 | #320 | Tragic 7.3% |
| Immigrants | Caribbean | 0.0 /100 | #321 | Tragic 7.3% |
| Immigrants | Honduras | 0.0 /100 | #322 | Tragic 7.3% |
| Vietnamese | 0.0 /100 | #323 | Tragic 7.4% |
| Immigrants | Central America | 0.0 /100 | #324 | Tragic 7.4% |
| Immigrants | Cuba | 0.0 /100 | #325 | Tragic 7.5% |
| Immigrants | Bangladesh | 0.0 /100 | #326 | Tragic 7.5% |
| Hispanics or Latinos | 0.0 /100 | #327 | Tragic 7.5% |
| Immigrants | Mexico | 0.0 /100 | #328 | Tragic 7.6% |
| Natives/Alaskans | 0.0 /100 | #329 | Tragic 8.2% |
Demographics Similar to Tlingit-Haida by Married-Couple Family Poverty
In terms of married-couple family poverty, the demographic groups most similar to Tlingit-Haida are Immigrants from Sweden (4.4%, a difference of 0.070%), Okinawan (4.4%, a difference of 0.11%), Immigrants from Australia (4.4%, a difference of 0.12%), Immigrants from Sri Lanka (4.4%, a difference of 0.49%), and Czechoslovakian (4.4%, a difference of 0.62%).
| Demographics | Rating | Rank | Married-Couple Family Poverty |
| Welsh | 99.7 /100 | #53 | Exceptional 4.3% |
| Austrians | 99.7 /100 | #54 | Exceptional 4.3% |
| French | 99.7 /100 | #55 | Exceptional 4.3% |
| Immigrants | Zimbabwe | 99.7 /100 | #56 | Exceptional 4.3% |
| Immigrants | Netherlands | 99.7 /100 | #57 | Exceptional 4.3% |
| Czechoslovakians | 99.7 /100 | #58 | Exceptional 4.4% |
| Immigrants | Sweden | 99.6 /100 | #59 | Exceptional 4.4% |
| Tlingit-Haida | 99.6 /100 | #60 | Exceptional 4.4% |
| Okinawans | 99.6 /100 | #61 | Exceptional 4.4% |
| Immigrants | Australia | 99.6 /100 | #62 | Exceptional 4.4% |
| Immigrants | Sri Lanka | 99.6 /100 | #63 | Exceptional 4.4% |
| Immigrants | Bulgaria | 99.5 /100 | #64 | Exceptional 4.4% |
| Macedonians | 99.4 /100 | #65 | Exceptional 4.4% |
| Immigrants | Serbia | 99.4 /100 | #66 | Exceptional 4.4% |
| Immigrants | Canada | 99.4 /100 | #67 | Exceptional 4.4% |