Alsatian vs Immigrants from Trinidad and Tobago Married-Couple Family Poverty
COMPARE
Alsatian
Immigrants from Trinidad and Tobago
Married-Couple Family Poverty
Married-Couple Family Poverty Comparison
Alsatians
Immigrants from Trinidad and Tobago
5.2%
MARRIED-COUPLE FAMILY POVERTY
51.2/ 100
METRIC RATING
173rd/ 347
METRIC RANK
6.4%
MARRIED-COUPLE FAMILY POVERTY
0.1/ 100
METRIC RATING
278th/ 347
METRIC RANK
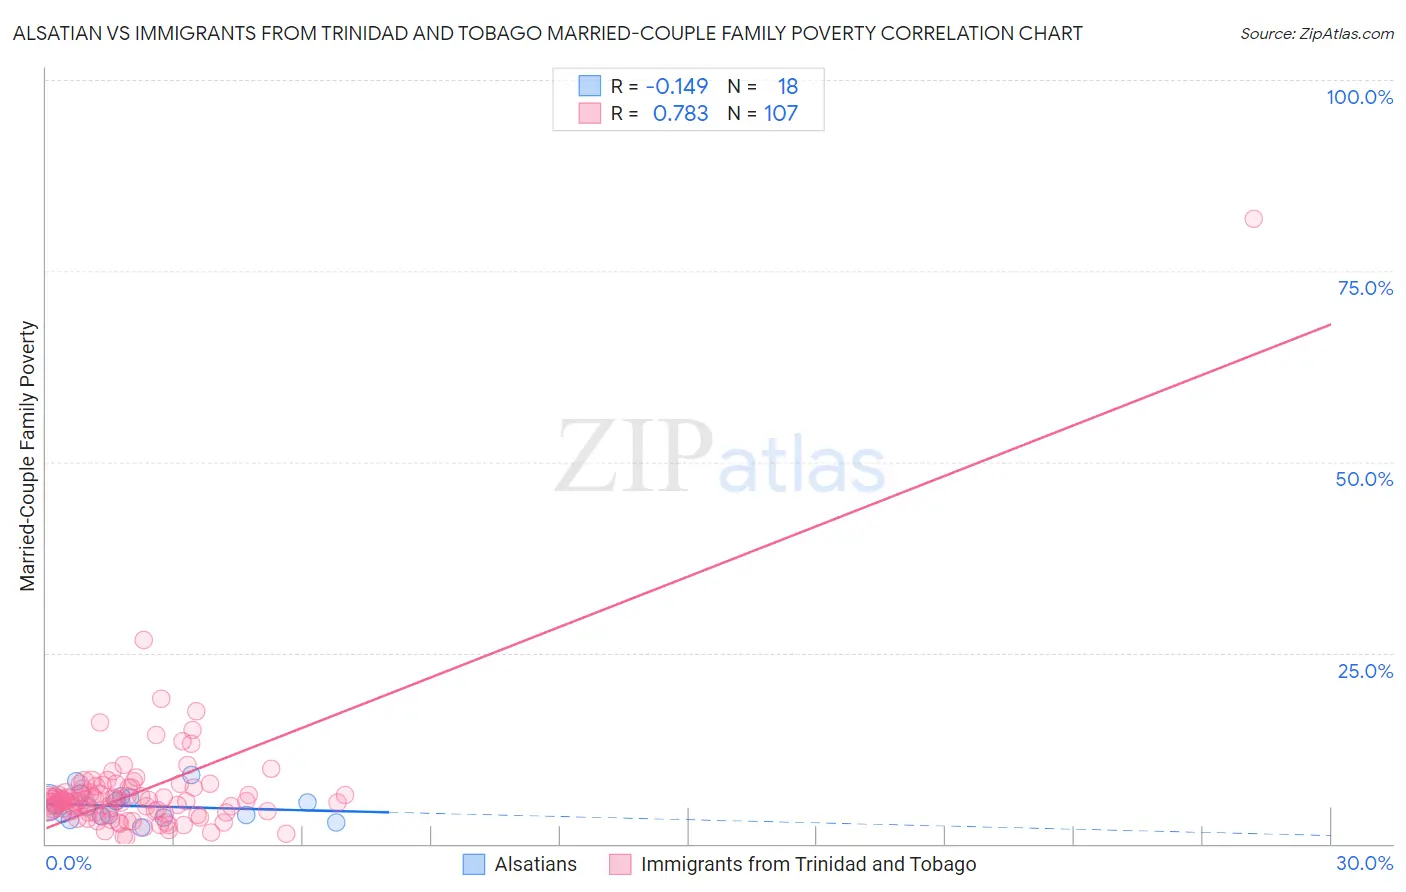
Alsatian vs Immigrants from Trinidad and Tobago Married-Couple Family Poverty Correlation Chart
The statistical analysis conducted on geographies consisting of 82,494,260 people shows a poor negative correlation between the proportion of Alsatians and poverty level among married-couple families in the United States with a correlation coefficient (R) of -0.149 and weighted average of 5.2%. Similarly, the statistical analysis conducted on geographies consisting of 222,433,461 people shows a strong positive correlation between the proportion of Immigrants from Trinidad and Tobago and poverty level among married-couple families in the United States with a correlation coefficient (R) of 0.783 and weighted average of 6.4%, a difference of 22.1%.
Married-Couple Family Poverty Correlation Summary
| Measurement | Alsatian | Immigrants from Trinidad and Tobago |
| Minimum | 2.2% | 0.88% |
| Maximum | 8.9% | 81.8% |
| Range | 6.8% | 80.9% |
| Mean | 4.9% | 6.9% |
| Median | 5.0% | 5.6% |
| Interquartile 25% (IQ1) | 3.6% | 4.1% |
| Interquartile 75% (IQ3) | 6.0% | 7.4% |
| Interquartile Range (IQR) | 2.4% | 3.2% |
| Standard Deviation (Sample) | 1.8% | 8.2% |
| Standard Deviation (Population) | 1.8% | 8.2% |
Similar Demographics by Married-Couple Family Poverty
Demographics Similar to Alsatians by Married-Couple Family Poverty
In terms of married-couple family poverty, the demographic groups most similar to Alsatians are Immigrants from Northern Africa (5.2%, a difference of 0.020%), Immigrants from Eastern Africa (5.2%, a difference of 0.14%), Bermudan (5.2%, a difference of 0.20%), Immigrants from Argentina (5.2%, a difference of 0.37%), and Marshallese (5.2%, a difference of 0.38%).
| Demographics | Rating | Rank | Married-Couple Family Poverty |
| Paraguayans | 61.5 /100 | #166 | Good 5.1% |
| Costa Ricans | 61.5 /100 | #167 | Good 5.1% |
| Immigrants | Uganda | 54.9 /100 | #168 | Average 5.2% |
| Ottawa | 54.5 /100 | #169 | Average 5.2% |
| Immigrants | Argentina | 54.4 /100 | #170 | Average 5.2% |
| Bermudans | 52.9 /100 | #171 | Average 5.2% |
| Immigrants | Northern Africa | 51.3 /100 | #172 | Average 5.2% |
| Alsatians | 51.2 /100 | #173 | Average 5.2% |
| Immigrants | Eastern Africa | 50.0 /100 | #174 | Average 5.2% |
| Marshallese | 47.9 /100 | #175 | Average 5.2% |
| Menominee | 47.8 /100 | #176 | Average 5.2% |
| Immigrants | Kazakhstan | 45.1 /100 | #177 | Average 5.2% |
| Immigrants | Ukraine | 44.9 /100 | #178 | Average 5.2% |
| Spanish | 41.4 /100 | #179 | Average 5.3% |
| Immigrants | Sierra Leone | 39.3 /100 | #180 | Fair 5.3% |
Demographics Similar to Immigrants from Trinidad and Tobago by Married-Couple Family Poverty
In terms of married-couple family poverty, the demographic groups most similar to Immigrants from Trinidad and Tobago are Houma (6.4%, a difference of 0.25%), West Indian (6.4%, a difference of 0.29%), Indonesian (6.3%, a difference of 0.48%), Yaqui (6.3%, a difference of 0.62%), and Mexican American Indian (6.4%, a difference of 0.80%).
| Demographics | Rating | Rank | Married-Couple Family Poverty |
| Immigrants | Bahamas | 0.1 /100 | #271 | Tragic 6.2% |
| Trinidadians and Tobagonians | 0.1 /100 | #272 | Tragic 6.2% |
| Colville | 0.1 /100 | #273 | Tragic 6.3% |
| Barbadians | 0.1 /100 | #274 | Tragic 6.3% |
| Choctaw | 0.1 /100 | #275 | Tragic 6.3% |
| Yaqui | 0.1 /100 | #276 | Tragic 6.3% |
| Indonesians | 0.1 /100 | #277 | Tragic 6.3% |
| Immigrants | Trinidad and Tobago | 0.1 /100 | #278 | Tragic 6.4% |
| Houma | 0.0 /100 | #279 | Tragic 6.4% |
| West Indians | 0.0 /100 | #280 | Tragic 6.4% |
| Mexican American Indians | 0.0 /100 | #281 | Tragic 6.4% |
| Seminole | 0.0 /100 | #282 | Tragic 6.4% |
| Ute | 0.0 /100 | #283 | Tragic 6.4% |
| Dutch West Indians | 0.0 /100 | #284 | Tragic 6.4% |
| Blacks/African Americans | 0.0 /100 | #285 | Tragic 6.5% |