Alsatian vs Immigrants from Fiji Married-Couple Family Poverty
COMPARE
Alsatian
Immigrants from Fiji
Married-Couple Family Poverty
Married-Couple Family Poverty Comparison
Alsatians
Immigrants from Fiji
5.2%
MARRIED-COUPLE FAMILY POVERTY
51.2/ 100
METRIC RATING
173rd/ 347
METRIC RANK
5.6%
MARRIED-COUPLE FAMILY POVERTY
6.7/ 100
METRIC RATING
223rd/ 347
METRIC RANK
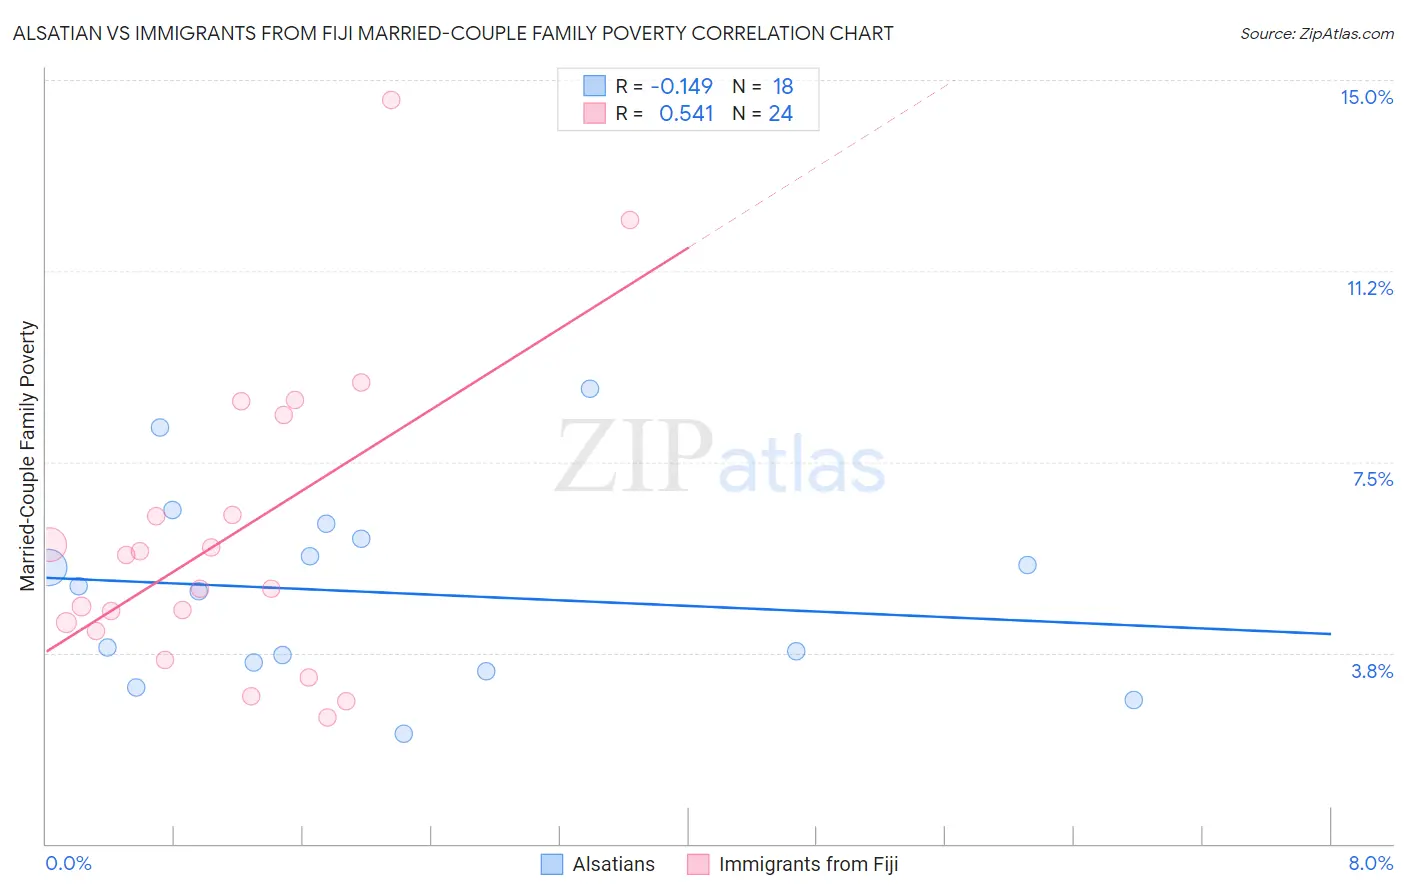
Alsatian vs Immigrants from Fiji Married-Couple Family Poverty Correlation Chart
The statistical analysis conducted on geographies consisting of 82,494,260 people shows a poor negative correlation between the proportion of Alsatians and poverty level among married-couple families in the United States with a correlation coefficient (R) of -0.149 and weighted average of 5.2%. Similarly, the statistical analysis conducted on geographies consisting of 93,642,085 people shows a substantial positive correlation between the proportion of Immigrants from Fiji and poverty level among married-couple families in the United States with a correlation coefficient (R) of 0.541 and weighted average of 5.6%, a difference of 7.8%.
Married-Couple Family Poverty Correlation Summary
| Measurement | Alsatian | Immigrants from Fiji |
| Minimum | 2.2% | 2.5% |
| Maximum | 8.9% | 14.6% |
| Range | 6.8% | 12.1% |
| Mean | 4.9% | 6.0% |
| Median | 5.0% | 5.3% |
| Interquartile 25% (IQ1) | 3.6% | 4.3% |
| Interquartile 75% (IQ3) | 6.0% | 7.4% |
| Interquartile Range (IQR) | 2.4% | 3.2% |
| Standard Deviation (Sample) | 1.8% | 3.0% |
| Standard Deviation (Population) | 1.8% | 2.9% |
Similar Demographics by Married-Couple Family Poverty
Demographics Similar to Alsatians by Married-Couple Family Poverty
In terms of married-couple family poverty, the demographic groups most similar to Alsatians are Immigrants from Northern Africa (5.2%, a difference of 0.020%), Immigrants from Eastern Africa (5.2%, a difference of 0.14%), Bermudan (5.2%, a difference of 0.20%), Immigrants from Argentina (5.2%, a difference of 0.37%), and Marshallese (5.2%, a difference of 0.38%).
| Demographics | Rating | Rank | Married-Couple Family Poverty |
| Paraguayans | 61.5 /100 | #166 | Good 5.1% |
| Costa Ricans | 61.5 /100 | #167 | Good 5.1% |
| Immigrants | Uganda | 54.9 /100 | #168 | Average 5.2% |
| Ottawa | 54.5 /100 | #169 | Average 5.2% |
| Immigrants | Argentina | 54.4 /100 | #170 | Average 5.2% |
| Bermudans | 52.9 /100 | #171 | Average 5.2% |
| Immigrants | Northern Africa | 51.3 /100 | #172 | Average 5.2% |
| Alsatians | 51.2 /100 | #173 | Average 5.2% |
| Immigrants | Eastern Africa | 50.0 /100 | #174 | Average 5.2% |
| Marshallese | 47.9 /100 | #175 | Average 5.2% |
| Menominee | 47.8 /100 | #176 | Average 5.2% |
| Immigrants | Kazakhstan | 45.1 /100 | #177 | Average 5.2% |
| Immigrants | Ukraine | 44.9 /100 | #178 | Average 5.2% |
| Spanish | 41.4 /100 | #179 | Average 5.3% |
| Immigrants | Sierra Leone | 39.3 /100 | #180 | Fair 5.3% |
Demographics Similar to Immigrants from Fiji by Married-Couple Family Poverty
In terms of married-couple family poverty, the demographic groups most similar to Immigrants from Fiji are Cajun (5.6%, a difference of 0.070%), Sudanese (5.6%, a difference of 0.11%), Immigrants from Cambodia (5.6%, a difference of 0.25%), South American (5.6%, a difference of 0.48%), and Immigrants from Zaire (5.6%, a difference of 0.49%).
| Demographics | Rating | Rank | Married-Couple Family Poverty |
| Potawatomi | 12.4 /100 | #216 | Poor 5.5% |
| Immigrants | Nigeria | 11.3 /100 | #217 | Poor 5.5% |
| Afghans | 11.2 /100 | #218 | Poor 5.5% |
| Japanese | 9.8 /100 | #219 | Tragic 5.6% |
| Colombians | 9.2 /100 | #220 | Tragic 5.6% |
| Panamanians | 9.2 /100 | #221 | Tragic 5.6% |
| Cajuns | 6.9 /100 | #222 | Tragic 5.6% |
| Immigrants | Fiji | 6.7 /100 | #223 | Tragic 5.6% |
| Sudanese | 6.4 /100 | #224 | Tragic 5.6% |
| Immigrants | Cambodia | 6.1 /100 | #225 | Tragic 5.6% |
| South Americans | 5.7 /100 | #226 | Tragic 5.6% |
| Immigrants | Zaire | 5.6 /100 | #227 | Tragic 5.6% |
| Arabs | 5.4 /100 | #228 | Tragic 5.7% |
| Sub-Saharan Africans | 4.9 /100 | #229 | Tragic 5.7% |
| Moroccans | 4.9 /100 | #230 | Tragic 5.7% |