Alaskan Athabascan vs Immigrants from Ireland Family Households
COMPARE
Alaskan Athabascan
Immigrants from Ireland
Family Households
Family Households Comparison
Alaskan Athabascans
Immigrants from Ireland
61.8%
FAMILY HOUSEHOLDS
0.0/ 100
METRIC RATING
318th/ 347
METRIC RANK
63.2%
FAMILY HOUSEHOLDS
0.6/ 100
METRIC RATING
262nd/ 347
METRIC RANK
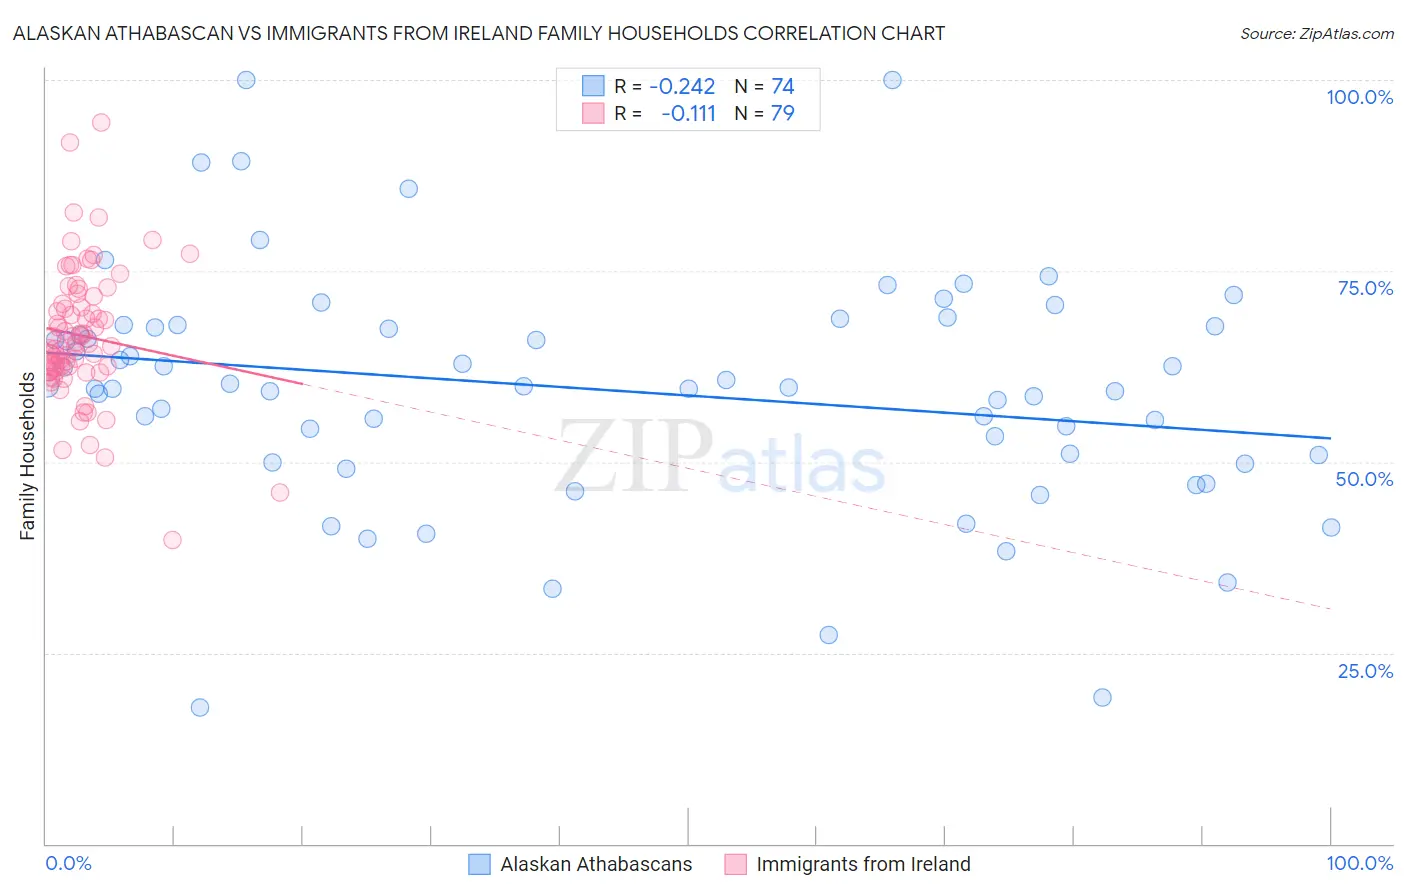
Alaskan Athabascan vs Immigrants from Ireland Family Households Correlation Chart
The statistical analysis conducted on geographies consisting of 45,815,060 people shows a weak negative correlation between the proportion of Alaskan Athabascans and percentage of family households in the United States with a correlation coefficient (R) of -0.242 and weighted average of 61.8%. Similarly, the statistical analysis conducted on geographies consisting of 240,750,325 people shows a poor negative correlation between the proportion of Immigrants from Ireland and percentage of family households in the United States with a correlation coefficient (R) of -0.111 and weighted average of 63.2%, a difference of 2.2%.
Family Households Correlation Summary
| Measurement | Alaskan Athabascan | Immigrants from Ireland |
| Minimum | 17.8% | 39.8% |
| Maximum | 100.0% | 94.4% |
| Range | 82.2% | 54.7% |
| Mean | 59.5% | 66.5% |
| Median | 59.8% | 65.5% |
| Interquartile 25% (IQ1) | 50.9% | 62.1% |
| Interquartile 75% (IQ3) | 67.7% | 71.7% |
| Interquartile Range (IQR) | 16.7% | 9.7% |
| Standard Deviation (Sample) | 15.5% | 8.8% |
| Standard Deviation (Population) | 15.4% | 8.8% |
Similar Demographics by Family Households
Demographics Similar to Alaskan Athabascans by Family Households
In terms of family households, the demographic groups most similar to Alaskan Athabascans are Cape Verdean (61.8%, a difference of 0.060%), Immigrants from Bosnia and Herzegovina (61.9%, a difference of 0.080%), Immigrants from Middle Africa (61.9%, a difference of 0.12%), Moroccan (61.9%, a difference of 0.16%), and Ugandan (61.7%, a difference of 0.18%).
| Demographics | Rating | Rank | Family Households |
| Immigrants | Morocco | 0.0 /100 | #311 | Tragic 62.0% |
| Immigrants | Latvia | 0.0 /100 | #312 | Tragic 62.0% |
| Liberians | 0.0 /100 | #313 | Tragic 62.0% |
| Immigrants | Cabo Verde | 0.0 /100 | #314 | Tragic 61.9% |
| Moroccans | 0.0 /100 | #315 | Tragic 61.9% |
| Immigrants | Middle Africa | 0.0 /100 | #316 | Tragic 61.9% |
| Immigrants | Bosnia and Herzegovina | 0.0 /100 | #317 | Tragic 61.9% |
| Alaskan Athabascans | 0.0 /100 | #318 | Tragic 61.8% |
| Cape Verdeans | 0.0 /100 | #319 | Tragic 61.8% |
| Ugandans | 0.0 /100 | #320 | Tragic 61.7% |
| Alsatians | 0.0 /100 | #321 | Tragic 61.7% |
| Immigrants | Serbia | 0.0 /100 | #322 | Tragic 61.6% |
| Tlingit-Haida | 0.0 /100 | #323 | Tragic 61.6% |
| Immigrants | West Indies | 0.0 /100 | #324 | Tragic 61.6% |
| Immigrants | Switzerland | 0.0 /100 | #325 | Tragic 61.6% |
Demographics Similar to Immigrants from Ireland by Family Households
In terms of family households, the demographic groups most similar to Immigrants from Ireland are Immigrants from Russia (63.2%, a difference of 0.010%), Cheyenne (63.2%, a difference of 0.020%), Cypriot (63.2%, a difference of 0.030%), Kenyan (63.2%, a difference of 0.030%), and Colville (63.2%, a difference of 0.040%).
| Demographics | Rating | Rank | Family Households |
| Potawatomi | 1.0 /100 | #255 | Tragic 63.3% |
| Luxembourgers | 0.9 /100 | #256 | Tragic 63.3% |
| Icelanders | 0.8 /100 | #257 | Tragic 63.3% |
| Immigrants | Barbados | 0.7 /100 | #258 | Tragic 63.2% |
| Immigrants | Western Europe | 0.6 /100 | #259 | Tragic 63.2% |
| Cypriots | 0.6 /100 | #260 | Tragic 63.2% |
| Immigrants | Russia | 0.6 /100 | #261 | Tragic 63.2% |
| Immigrants | Ireland | 0.6 /100 | #262 | Tragic 63.2% |
| Cheyenne | 0.5 /100 | #263 | Tragic 63.2% |
| Kenyans | 0.5 /100 | #264 | Tragic 63.2% |
| Colville | 0.5 /100 | #265 | Tragic 63.2% |
| Immigrants | Western Africa | 0.5 /100 | #266 | Tragic 63.1% |
| Israelis | 0.4 /100 | #267 | Tragic 63.1% |
| Immigrants | Singapore | 0.4 /100 | #268 | Tragic 63.1% |
| Yugoslavians | 0.4 /100 | #269 | Tragic 63.1% |