Immigrants from Iran vs Immigrants from Ireland Married-Couple Family Poverty
COMPARE
Immigrants from Iran
Immigrants from Ireland
Married-Couple Family Poverty
Married-Couple Family Poverty Comparison
Immigrants from Iran
Immigrants from Ireland
4.5%
MARRIED-COUPLE FAMILY POVERTY
99.0/ 100
METRIC RATING
79th/ 347
METRIC RANK
4.1%
MARRIED-COUPLE FAMILY POVERTY
99.9/ 100
METRIC RATING
19th/ 347
METRIC RANK
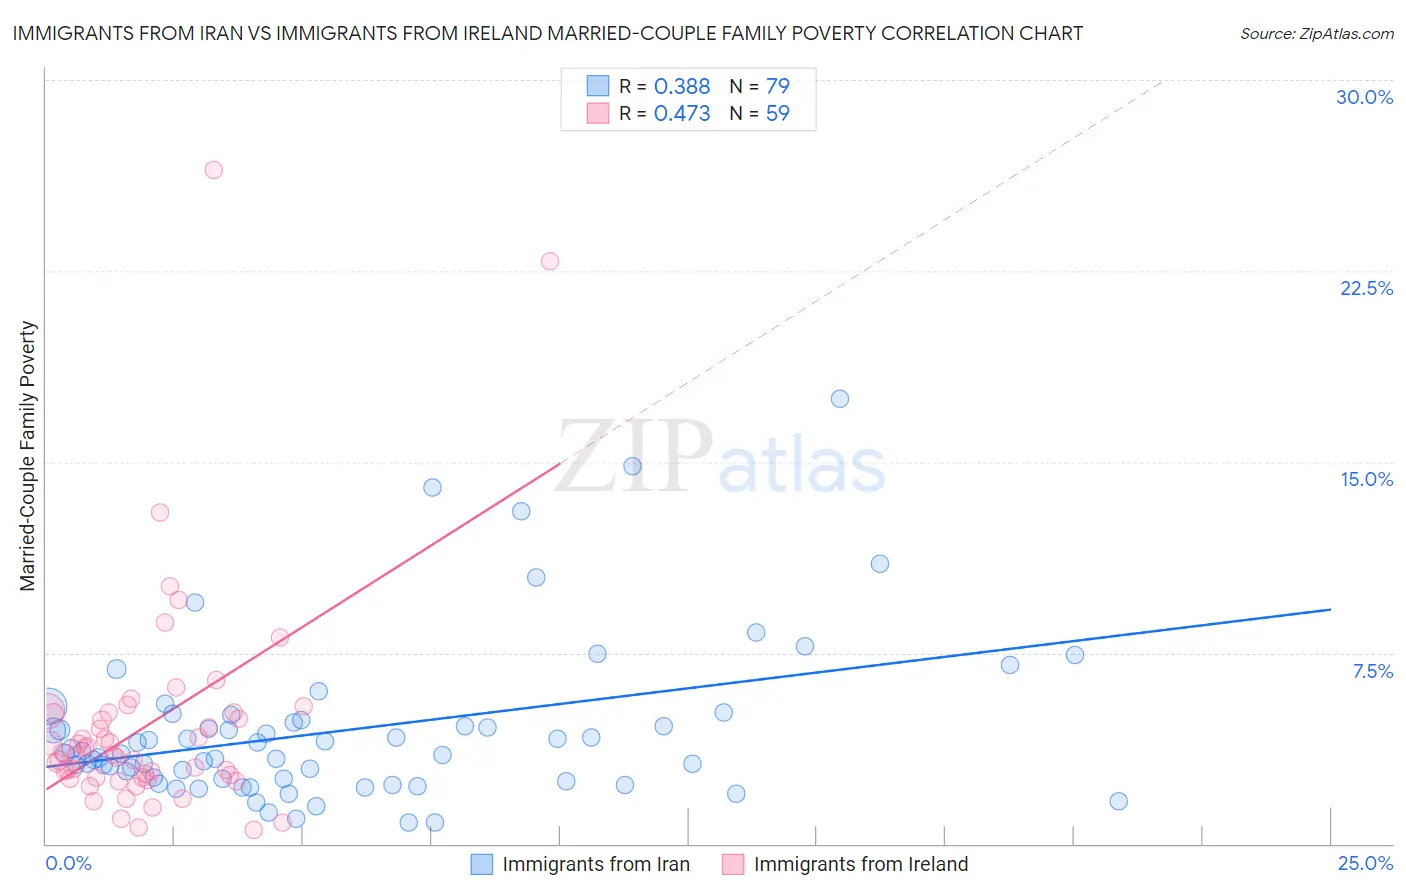
Immigrants from Iran vs Immigrants from Ireland Married-Couple Family Poverty Correlation Chart
The statistical analysis conducted on geographies consisting of 278,379,218 people shows a mild positive correlation between the proportion of Immigrants from Iran and poverty level among married-couple families in the United States with a correlation coefficient (R) of 0.388 and weighted average of 4.5%. Similarly, the statistical analysis conducted on geographies consisting of 239,104,626 people shows a moderate positive correlation between the proportion of Immigrants from Ireland and poverty level among married-couple families in the United States with a correlation coefficient (R) of 0.473 and weighted average of 4.1%, a difference of 11.2%.
Married-Couple Family Poverty Correlation Summary
| Measurement | Immigrants from Iran | Immigrants from Ireland |
| Minimum | 0.82% | 0.56% |
| Maximum | 17.5% | 26.5% |
| Range | 16.7% | 25.9% |
| Mean | 4.5% | 4.7% |
| Median | 3.5% | 3.5% |
| Interquartile 25% (IQ1) | 2.5% | 2.6% |
| Interquartile 75% (IQ3) | 4.9% | 5.1% |
| Interquartile Range (IQR) | 2.3% | 2.5% |
| Standard Deviation (Sample) | 3.2% | 4.4% |
| Standard Deviation (Population) | 3.2% | 4.4% |
Similar Demographics by Married-Couple Family Poverty
Demographics Similar to Immigrants from Iran by Married-Couple Family Poverty
In terms of married-couple family poverty, the demographic groups most similar to Immigrants from Iran are Icelander (4.5%, a difference of 0.060%), Immigrants from Greece (4.5%, a difference of 0.20%), Scotch-Irish (4.5%, a difference of 0.23%), Immigrants from Latvia (4.5%, a difference of 0.31%), and Canadian (4.5%, a difference of 0.45%).
| Demographics | Rating | Rank | Married-Couple Family Poverty |
| Immigrants | England | 99.3 /100 | #72 | Exceptional 4.5% |
| Ukrainians | 99.2 /100 | #73 | Exceptional 4.5% |
| Immigrants | Austria | 99.2 /100 | #74 | Exceptional 4.5% |
| Cambodians | 99.2 /100 | #75 | Exceptional 4.5% |
| Immigrants | South Africa | 99.1 /100 | #76 | Exceptional 4.5% |
| Immigrants | Latvia | 99.1 /100 | #77 | Exceptional 4.5% |
| Scotch-Irish | 99.1 /100 | #78 | Exceptional 4.5% |
| Immigrants | Iran | 99.0 /100 | #79 | Exceptional 4.5% |
| Icelanders | 99.0 /100 | #80 | Exceptional 4.5% |
| Immigrants | Greece | 98.9 /100 | #81 | Exceptional 4.5% |
| Canadians | 98.8 /100 | #82 | Exceptional 4.5% |
| Immigrants | Denmark | 98.8 /100 | #83 | Exceptional 4.6% |
| Immigrants | Croatia | 98.7 /100 | #84 | Exceptional 4.6% |
| South Africans | 98.7 /100 | #85 | Exceptional 4.6% |
| Immigrants | Turkey | 98.6 /100 | #86 | Exceptional 4.6% |
Demographics Similar to Immigrants from Ireland by Married-Couple Family Poverty
In terms of married-couple family poverty, the demographic groups most similar to Immigrants from Ireland are Maltese (4.1%, a difference of 0.25%), Zimbabwean (4.1%, a difference of 0.27%), Immigrants from Singapore (4.1%, a difference of 0.64%), Bhutanese (4.1%, a difference of 0.66%), and Italian (4.0%, a difference of 0.78%).
| Demographics | Rating | Rank | Married-Couple Family Poverty |
| Bulgarians | 100.0 /100 | #12 | Exceptional 4.0% |
| Czechs | 100.0 /100 | #13 | Exceptional 4.0% |
| Slovaks | 100.0 /100 | #14 | Exceptional 4.0% |
| Poles | 100.0 /100 | #15 | Exceptional 4.0% |
| Germans | 100.0 /100 | #16 | Exceptional 4.0% |
| Filipinos | 100.0 /100 | #17 | Exceptional 4.0% |
| Italians | 100.0 /100 | #18 | Exceptional 4.0% |
| Immigrants | Ireland | 99.9 /100 | #19 | Exceptional 4.1% |
| Maltese | 99.9 /100 | #20 | Exceptional 4.1% |
| Zimbabweans | 99.9 /100 | #21 | Exceptional 4.1% |
| Immigrants | Singapore | 99.9 /100 | #22 | Exceptional 4.1% |
| Bhutanese | 99.9 /100 | #23 | Exceptional 4.1% |
| Eastern Europeans | 99.9 /100 | #24 | Exceptional 4.1% |
| Immigrants | Taiwan | 99.9 /100 | #25 | Exceptional 4.1% |
| Cypriots | 99.9 /100 | #26 | Exceptional 4.1% |