Zip Codes with the Highest Percentage of Population with a Degree in Liberal Arts and History in Greenville, MS
RELATED REPORTS & OPTIONS
Liberal Arts and History
Greenville
Compare Zip Codes
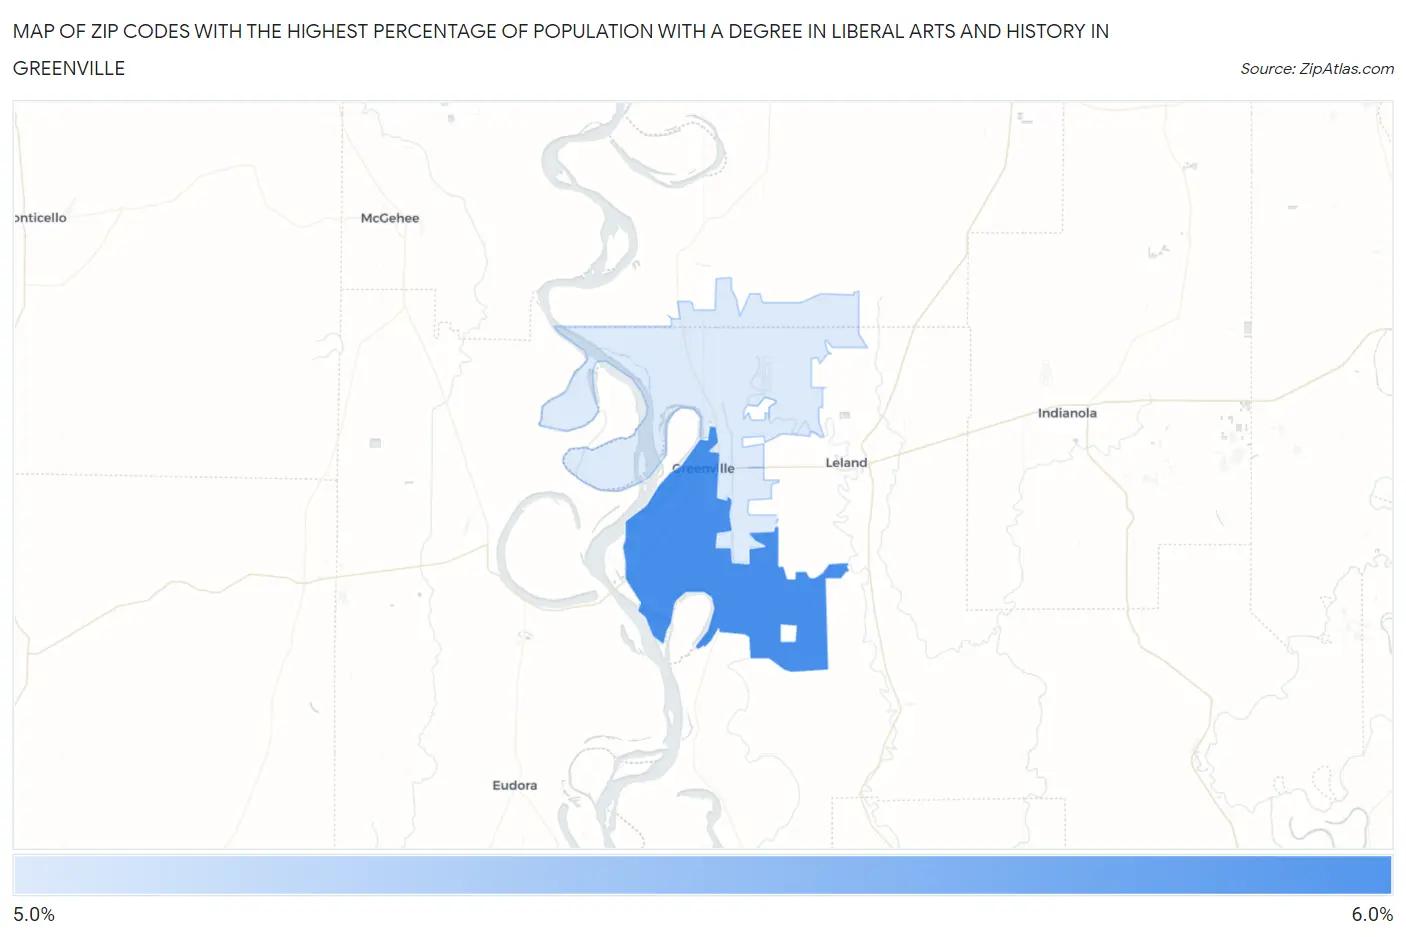
Map of Zip Codes with the Highest Percentage of Population with a Degree in Liberal Arts and History in Greenville
5.4%
5.7%
Zip Codes with the Highest Percentage of Population with a Degree in Liberal Arts and History in Greenville, MS
| Zip Code | % Graduates | vs State | vs National | |
| 1. | 38701 | 5.7% | 4.2%(+1.55)#93 | 4.9%(+0.833)#9,293 |
| 2. | 38703 | 5.4% | 4.2%(+1.29)#100 | 4.9%(+0.574)#10,013 |
1
Common Questions
What are the Top Zip Codes with the Highest Percentage of Population with a Degree in Liberal Arts and History in Greenville, MS?
Top Zip Codes with the Highest Percentage of Population with a Degree in Liberal Arts and History in Greenville, MS are:
What zip code has the Highest Percentage of Population with a Degree in Liberal Arts and History in Greenville, MS?
38701 has the Highest Percentage of Population with a Degree in Liberal Arts and History in Greenville, MS with 5.7%.
What is the Percentage of Population with a Degree in Liberal Arts and History in Greenville, MS?
Percentage of Population with a Degree in Liberal Arts and History in Greenville is 6.3%.
What is the Percentage of Population with a Degree in Liberal Arts and History in Mississippi?
Percentage of Population with a Degree in Liberal Arts and History in Mississippi is 4.2%.
What is the Percentage of Population with a Degree in Liberal Arts and History in the United States?
Percentage of Population with a Degree in Liberal Arts and History in the United States is 4.9%.