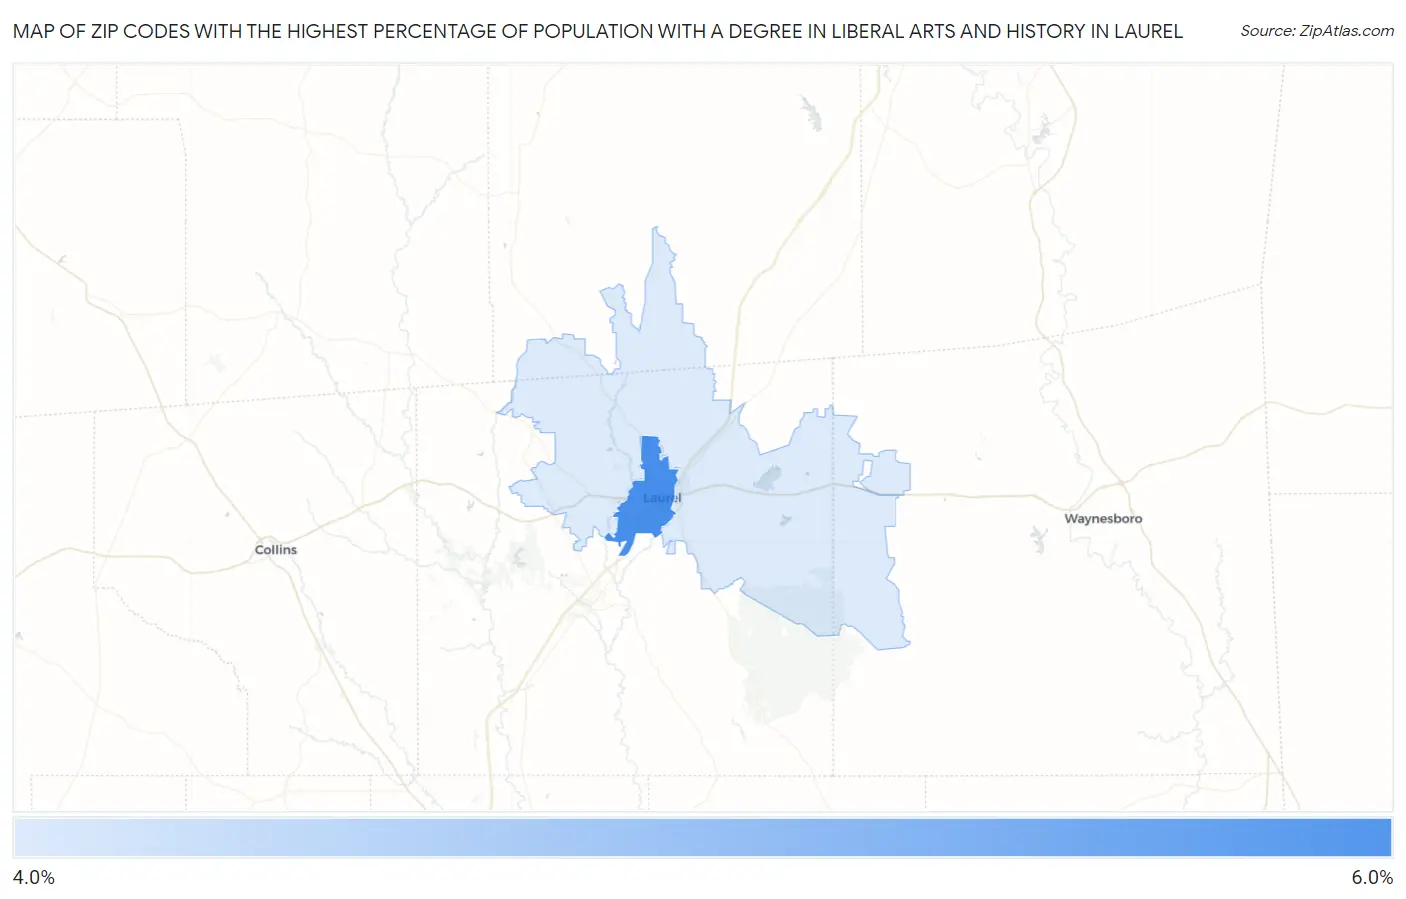
Zip Codes with the Highest Percentage of Population with a Degree in Liberal Arts and History in Laurel, MS
RELATED REPORTS & OPTIONS
Liberal Arts and History
Laurel
Compare Zip Codes
Map of Zip Codes with the Highest Percentage of Population with a Degree in Liberal Arts and History in Laurel
4.3%
5.6%
Zip Codes with the Highest Percentage of Population with a Degree in Liberal Arts and History in Laurel, MS
| Zip Code | % Graduates | vs State | vs National | |
| 1. | 39440 | 5.6% | 4.2%(+1.46)#95 | 4.9%(+0.739)#9,541 |
| 2. | 39443 | 4.3% | 4.2%(+0.137)#129 | 4.9%(-0.580)#13,665 |
1
Common Questions
What are the Top Zip Codes with the Highest Percentage of Population with a Degree in Liberal Arts and History in Laurel, MS?
Top Zip Codes with the Highest Percentage of Population with a Degree in Liberal Arts and History in Laurel, MS are:
What zip code has the Highest Percentage of Population with a Degree in Liberal Arts and History in Laurel, MS?
39440 has the Highest Percentage of Population with a Degree in Liberal Arts and History in Laurel, MS with 5.6%.
What is the Percentage of Population with a Degree in Liberal Arts and History in Laurel, MS?
Percentage of Population with a Degree in Liberal Arts and History in Laurel is 3.7%.
What is the Percentage of Population with a Degree in Liberal Arts and History in Mississippi?
Percentage of Population with a Degree in Liberal Arts and History in Mississippi is 4.2%.
What is the Percentage of Population with a Degree in Liberal Arts and History in the United States?
Percentage of Population with a Degree in Liberal Arts and History in the United States is 4.9%.