Zip Codes with the Highest Percentage of Population with a Degree in Liberal Arts and History in Kenner, LA
RELATED REPORTS & OPTIONS
Liberal Arts and History
Kenner
Compare Zip Codes
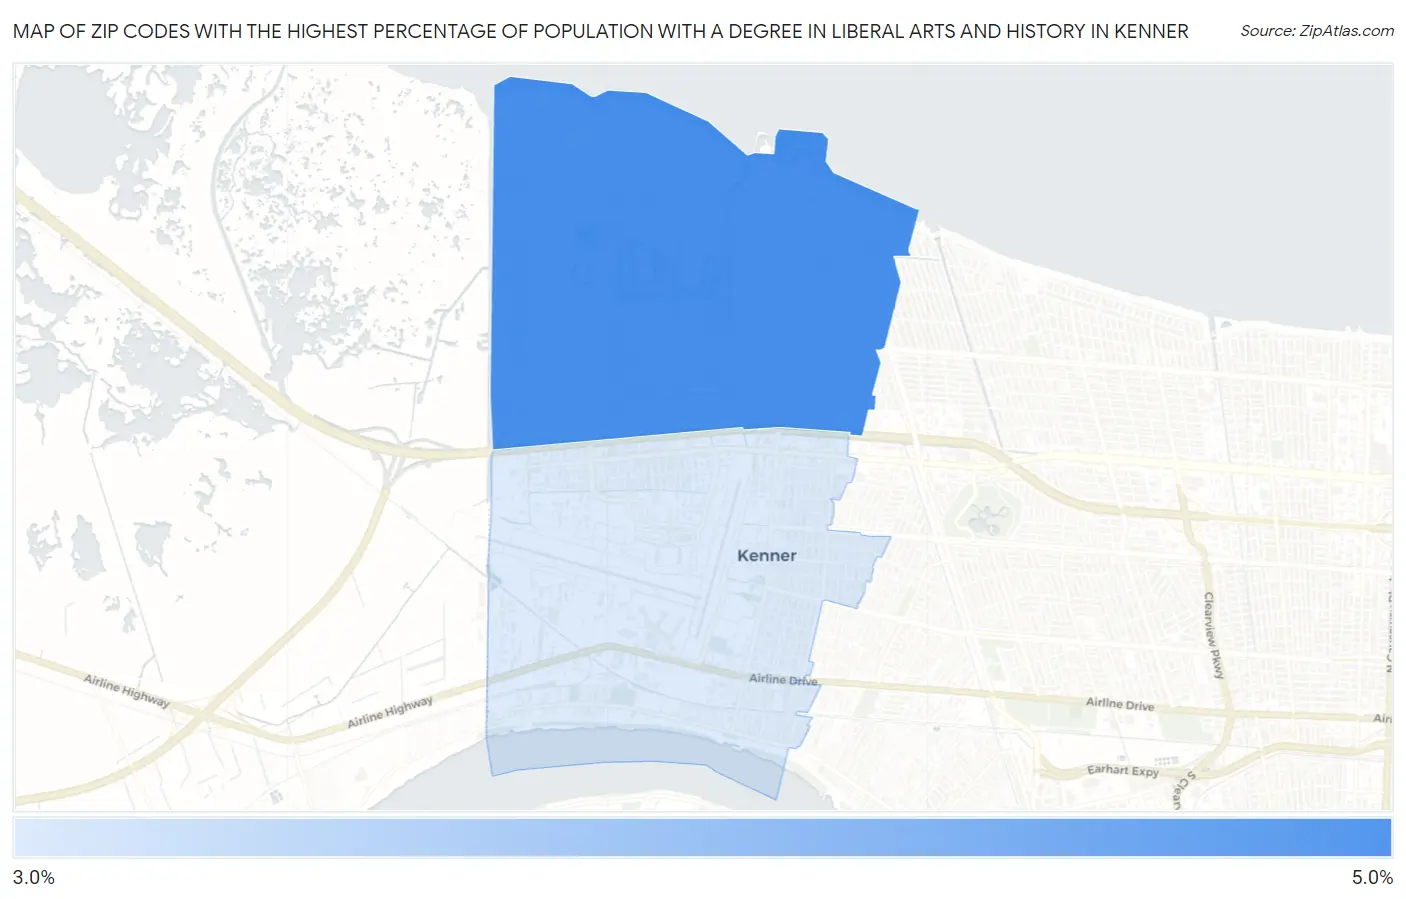
Map of Zip Codes with the Highest Percentage of Population with a Degree in Liberal Arts and History in Kenner
3.4%
4.5%
Zip Codes with the Highest Percentage of Population with a Degree in Liberal Arts and History in Kenner, LA
| Zip Code | % Graduates | vs State | vs National | |
| 1. | 70065 | 4.5% | 7.4%(-2.91)#289 | 4.9%(-0.331)#12,851 |
| 2. | 70062 | 3.4% | 7.4%(-4.04)#321 | 4.9%(-1.46)#16,938 |
1
Common Questions
What are the Top Zip Codes with the Highest Percentage of Population with a Degree in Liberal Arts and History in Kenner, LA?
Top Zip Codes with the Highest Percentage of Population with a Degree in Liberal Arts and History in Kenner, LA are:
What zip code has the Highest Percentage of Population with a Degree in Liberal Arts and History in Kenner, LA?
70065 has the Highest Percentage of Population with a Degree in Liberal Arts and History in Kenner, LA with 4.5%.
What is the Percentage of Population with a Degree in Liberal Arts and History in Kenner, LA?
Percentage of Population with a Degree in Liberal Arts and History in Kenner is 4.4%.
What is the Percentage of Population with a Degree in Liberal Arts and History in Louisiana?
Percentage of Population with a Degree in Liberal Arts and History in Louisiana is 7.4%.
What is the Percentage of Population with a Degree in Liberal Arts and History in the United States?
Percentage of Population with a Degree in Liberal Arts and History in the United States is 4.9%.