Zip Codes with the Highest Percentage of Population with a Degree in Liberal Arts and History in Lake Charles, LA
RELATED REPORTS & OPTIONS
Liberal Arts and History
Lake Charles
Compare Zip Codes
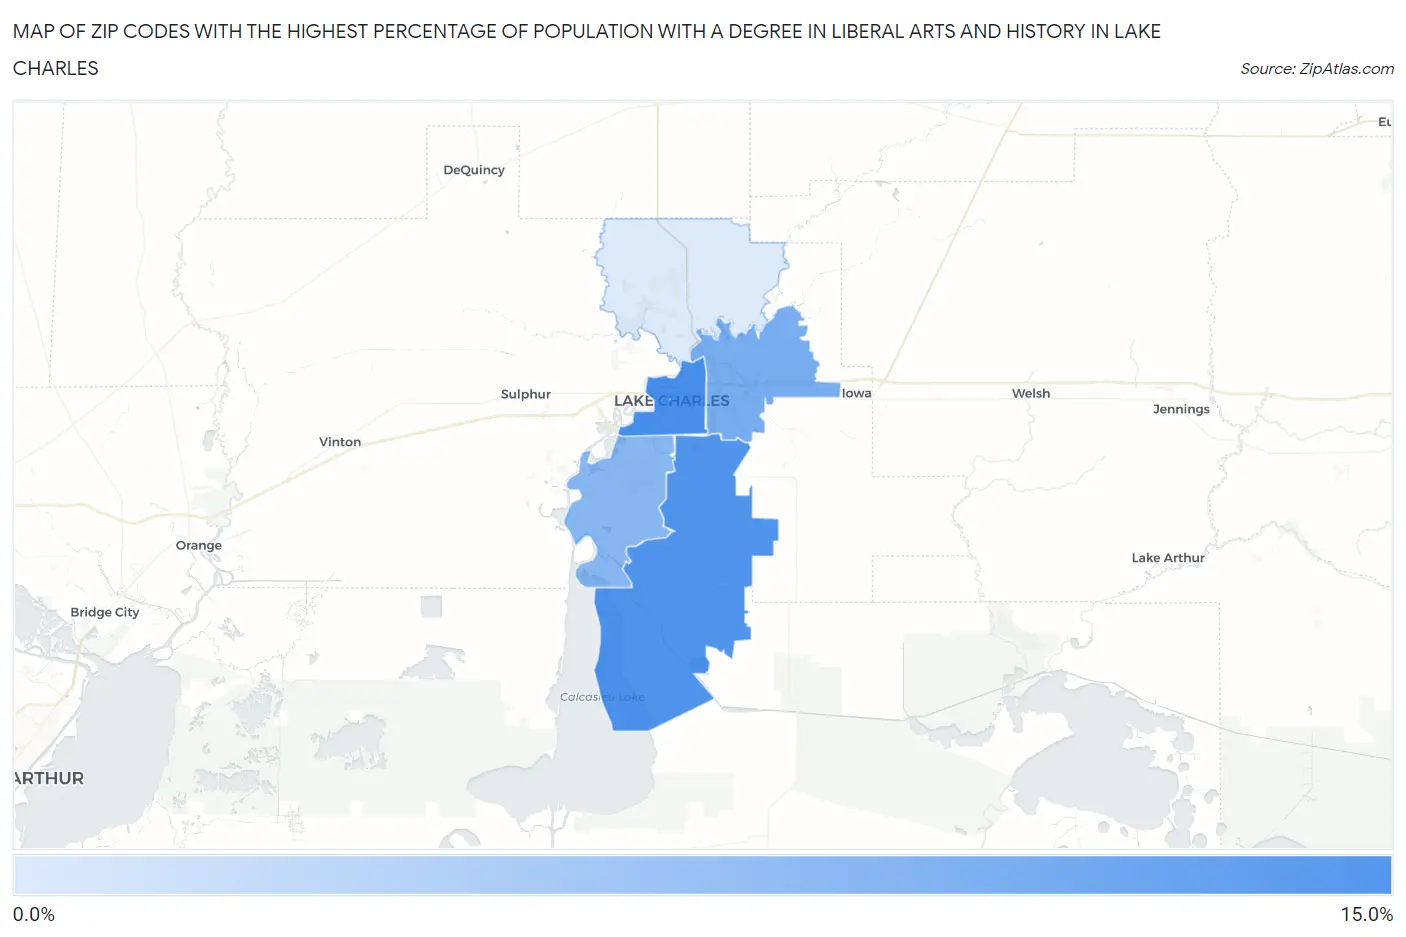
Map of Zip Codes with the Highest Percentage of Population with a Degree in Liberal Arts and History in Lake Charles
3.0%
10.2%
Zip Codes with the Highest Percentage of Population with a Degree in Liberal Arts and History in Lake Charles, LA
| Zip Code | % Graduates | vs State | vs National | |
| 1. | 70601 | 10.2% | 7.4%(+2.78)#112 | 4.9%(+5.35)#2,983 |
| 2. | 70607 | 9.8% | 7.4%(+2.37)#118 | 4.9%(+4.94)#3,229 |
| 3. | 70615 | 7.9% | 7.4%(+0.412)#170 | 4.9%(+2.99)#5,084 |
| 4. | 70605 | 7.0% | 7.4%(-0.398)#204 | 4.9%(+2.18)#6,305 |
| 5. | 70611 | 3.0% | 7.4%(-4.45)#331 | 4.9%(-1.88)#18,371 |
1
Common Questions
What are the Top 3 Zip Codes with the Highest Percentage of Population with a Degree in Liberal Arts and History in Lake Charles, LA?
Top 3 Zip Codes with the Highest Percentage of Population with a Degree in Liberal Arts and History in Lake Charles, LA are:
What zip code has the Highest Percentage of Population with a Degree in Liberal Arts and History in Lake Charles, LA?
70601 has the Highest Percentage of Population with a Degree in Liberal Arts and History in Lake Charles, LA with 10.2%.
What is the Percentage of Population with a Degree in Liberal Arts and History in Lake Charles, LA?
Percentage of Population with a Degree in Liberal Arts and History in Lake Charles is 9.8%.
What is the Percentage of Population with a Degree in Liberal Arts and History in Louisiana?
Percentage of Population with a Degree in Liberal Arts and History in Louisiana is 7.4%.
What is the Percentage of Population with a Degree in Liberal Arts and History in the United States?
Percentage of Population with a Degree in Liberal Arts and History in the United States is 4.9%.