Nepalese vs Immigrants from Netherlands Median Female Earnings
COMPARE
Nepalese
Immigrants from Netherlands
Median Female Earnings
Median Female Earnings Comparison
Nepalese
Immigrants from Netherlands
$38,603
MEDIAN FEMALE EARNINGS
9.3/ 100
METRIC RATING
219th/ 347
METRIC RANK
$41,870
MEDIAN FEMALE EARNINGS
98.9/ 100
METRIC RATING
95th/ 347
METRIC RANK
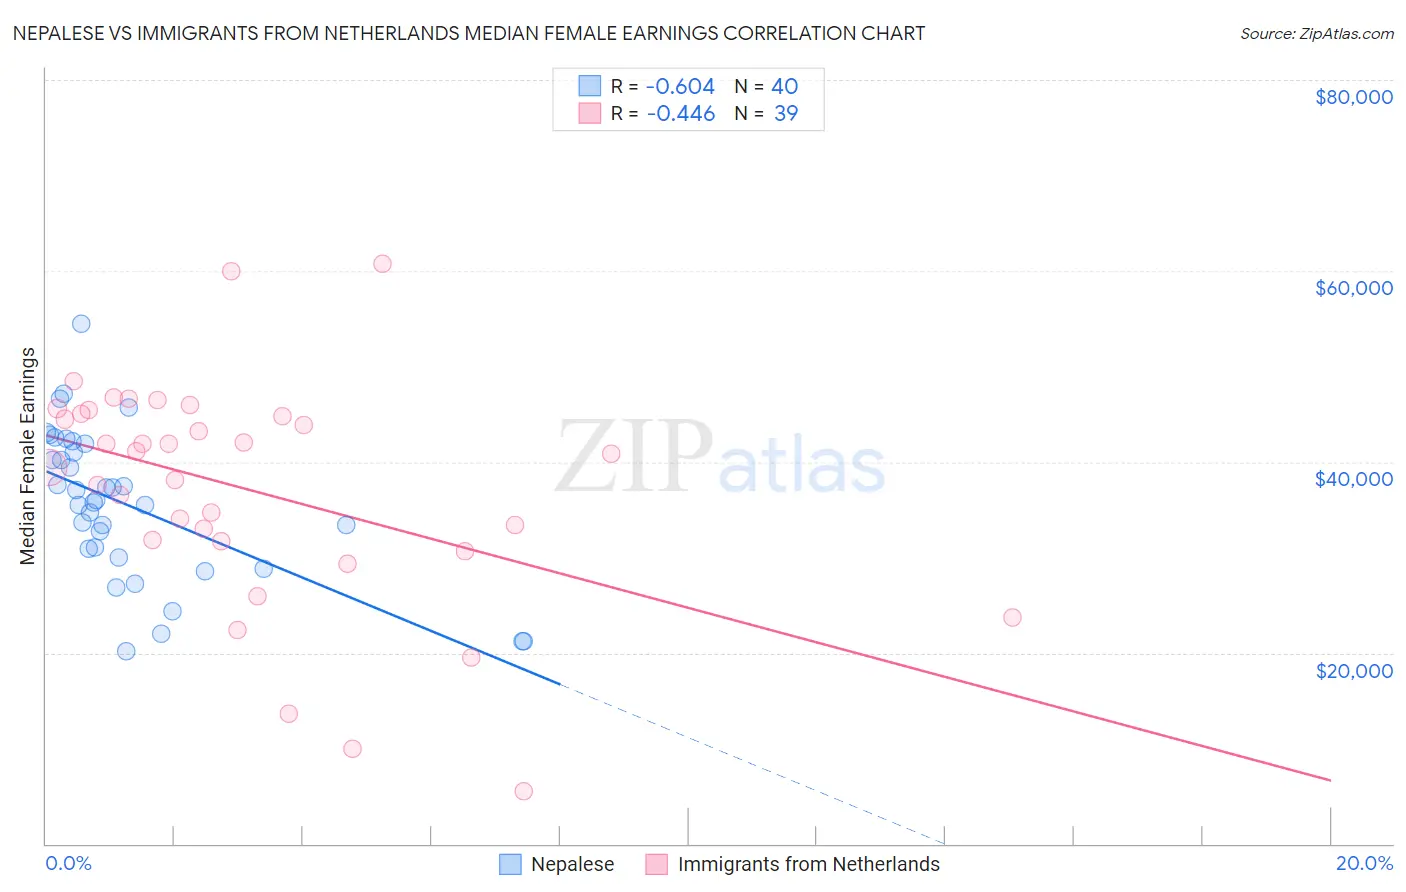
Nepalese vs Immigrants from Netherlands Median Female Earnings Correlation Chart
The statistical analysis conducted on geographies consisting of 24,521,755 people shows a significant negative correlation between the proportion of Nepalese and median female earnings in the United States with a correlation coefficient (R) of -0.604 and weighted average of $38,603. Similarly, the statistical analysis conducted on geographies consisting of 237,807,250 people shows a moderate negative correlation between the proportion of Immigrants from Netherlands and median female earnings in the United States with a correlation coefficient (R) of -0.446 and weighted average of $41,870, a difference of 8.5%.
Median Female Earnings Correlation Summary
| Measurement | Nepalese | Immigrants from Netherlands |
| Minimum | $20,210 | $5,512 |
| Maximum | $54,407 | $60,703 |
| Range | $34,197 | $55,191 |
| Mean | $35,483 | $37,129 |
| Median | $35,860 | $40,875 |
| Interquartile 25% (IQ1) | $30,426 | $31,744 |
| Interquartile 75% (IQ3) | $41,423 | $45,060 |
| Interquartile Range (IQR) | $10,997 | $13,315 |
| Standard Deviation (Sample) | $7,837 | $11,943 |
| Standard Deviation (Population) | $7,738 | $11,789 |
Similar Demographics by Median Female Earnings
Demographics Similar to Nepalese by Median Female Earnings
In terms of median female earnings, the demographic groups most similar to Nepalese are Cape Verdean ($38,614, a difference of 0.030%), Immigrants from Jamaica ($38,625, a difference of 0.060%), Yugoslavian ($38,573, a difference of 0.080%), Immigrants from the Azores ($38,573, a difference of 0.080%), and Immigrants from Ecuador ($38,644, a difference of 0.11%).
| Demographics | Rating | Rank | Median Female Earnings |
| Guamanians/Chamorros | 11.5 /100 | #212 | Poor $38,717 |
| Jamaicans | 10.5 /100 | #213 | Poor $38,670 |
| Iraqis | 10.5 /100 | #214 | Poor $38,666 |
| Spaniards | 10.3 /100 | #215 | Poor $38,656 |
| Immigrants | Ecuador | 10.1 /100 | #216 | Poor $38,644 |
| Immigrants | Jamaica | 9.7 /100 | #217 | Tragic $38,625 |
| Cape Verdeans | 9.5 /100 | #218 | Tragic $38,614 |
| Nepalese | 9.3 /100 | #219 | Tragic $38,603 |
| Yugoslavians | 8.8 /100 | #220 | Tragic $38,573 |
| Immigrants | Azores | 8.8 /100 | #221 | Tragic $38,573 |
| Japanese | 8.1 /100 | #222 | Tragic $38,528 |
| Immigrants | Sudan | 7.8 /100 | #223 | Tragic $38,511 |
| Native Hawaiians | 7.1 /100 | #224 | Tragic $38,461 |
| French | 7.0 /100 | #225 | Tragic $38,457 |
| French Canadians | 6.8 /100 | #226 | Tragic $38,436 |
Demographics Similar to Immigrants from Netherlands by Median Female Earnings
In terms of median female earnings, the demographic groups most similar to Immigrants from Netherlands are Moroccan ($41,872, a difference of 0.0%), South African ($41,825, a difference of 0.11%), Immigrants from Hungary ($41,820, a difference of 0.12%), Immigrants from Grenada ($41,932, a difference of 0.15%), and Argentinean ($41,952, a difference of 0.20%).
| Demographics | Rating | Rank | Median Female Earnings |
| Immigrants | Northern Africa | 99.3 /100 | #88 | Exceptional $42,084 |
| Immigrants | Afghanistan | 99.3 /100 | #89 | Exceptional $42,055 |
| Ukrainians | 99.2 /100 | #90 | Exceptional $42,015 |
| Immigrants | Western Europe | 99.2 /100 | #91 | Exceptional $41,990 |
| Argentineans | 99.1 /100 | #92 | Exceptional $41,952 |
| Immigrants | Grenada | 99.0 /100 | #93 | Exceptional $41,932 |
| Moroccans | 98.9 /100 | #94 | Exceptional $41,872 |
| Immigrants | Netherlands | 98.9 /100 | #95 | Exceptional $41,870 |
| South Africans | 98.8 /100 | #96 | Exceptional $41,825 |
| Immigrants | Hungary | 98.8 /100 | #97 | Exceptional $41,820 |
| Immigrants | Scotland | 98.7 /100 | #98 | Exceptional $41,771 |
| Immigrants | Barbados | 98.4 /100 | #99 | Exceptional $41,685 |
| Romanians | 98.3 /100 | #100 | Exceptional $41,663 |
| Immigrants | Fiji | 98.3 /100 | #101 | Exceptional $41,656 |
| Immigrants | Poland | 98.2 /100 | #102 | Exceptional $41,630 |