Cree vs Immigrants from Netherlands Median Female Earnings
COMPARE
Cree
Immigrants from Netherlands
Median Female Earnings
Median Female Earnings Comparison
Cree
Immigrants from Netherlands
$37,018
MEDIAN FEMALE EARNINGS
0.4/ 100
METRIC RATING
268th/ 347
METRIC RANK
$41,870
MEDIAN FEMALE EARNINGS
98.9/ 100
METRIC RATING
95th/ 347
METRIC RANK
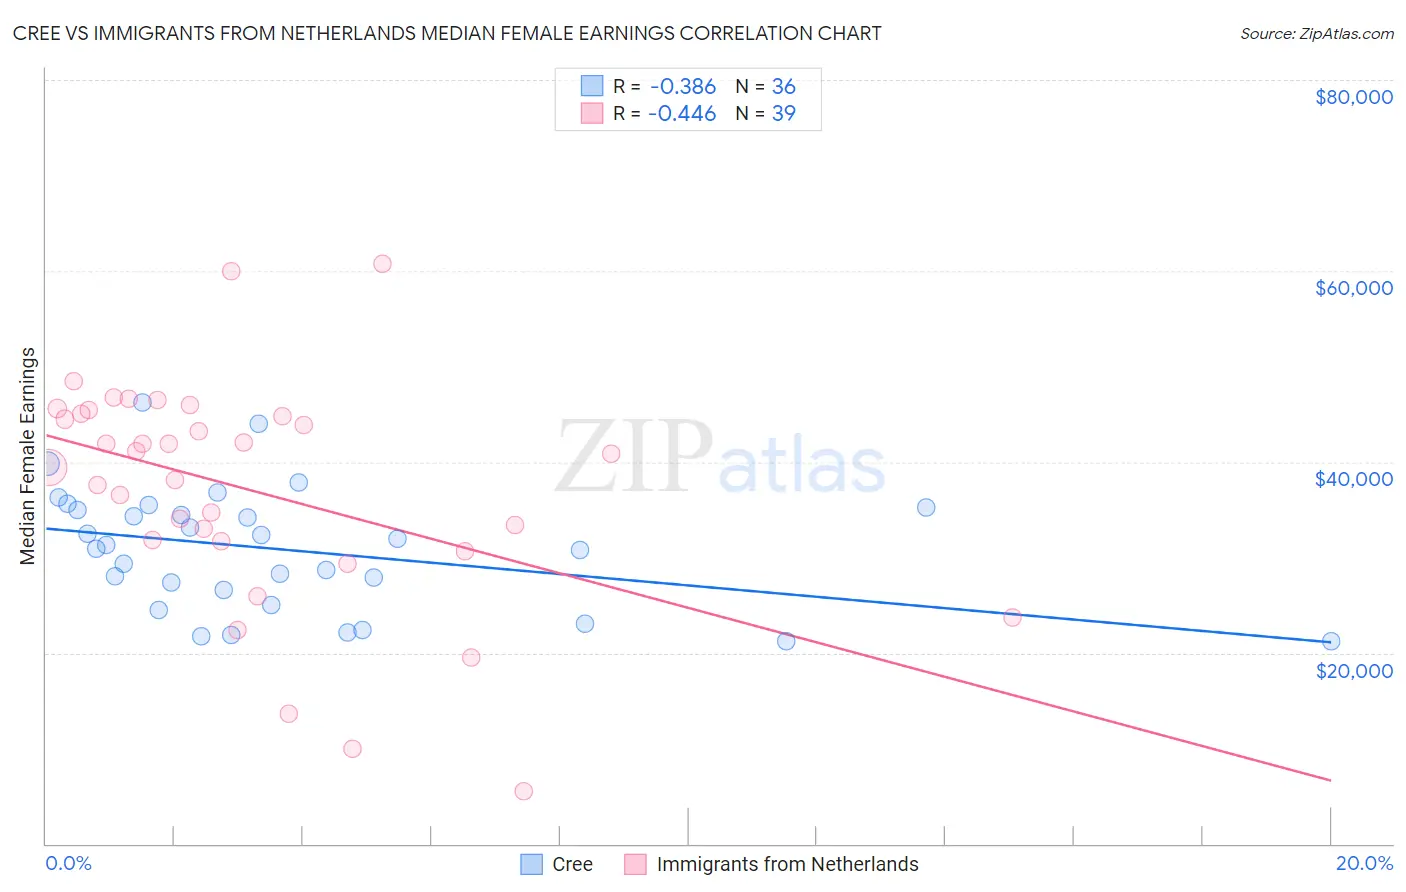
Cree vs Immigrants from Netherlands Median Female Earnings Correlation Chart
The statistical analysis conducted on geographies consisting of 76,188,527 people shows a mild negative correlation between the proportion of Cree and median female earnings in the United States with a correlation coefficient (R) of -0.386 and weighted average of $37,018. Similarly, the statistical analysis conducted on geographies consisting of 237,807,250 people shows a moderate negative correlation between the proportion of Immigrants from Netherlands and median female earnings in the United States with a correlation coefficient (R) of -0.446 and weighted average of $41,870, a difference of 13.1%.
Median Female Earnings Correlation Summary
| Measurement | Cree | Immigrants from Netherlands |
| Minimum | $21,250 | $5,512 |
| Maximum | $46,168 | $60,703 |
| Range | $24,918 | $55,191 |
| Mean | $30,765 | $37,129 |
| Median | $31,124 | $40,875 |
| Interquartile 25% (IQ1) | $25,810 | $31,744 |
| Interquartile 75% (IQ3) | $35,030 | $45,060 |
| Interquartile Range (IQR) | $9,221 | $13,315 |
| Standard Deviation (Sample) | $6,370 | $11,943 |
| Standard Deviation (Population) | $6,281 | $11,789 |
Similar Demographics by Median Female Earnings
Demographics Similar to Cree by Median Female Earnings
In terms of median female earnings, the demographic groups most similar to Cree are Nonimmigrants ($37,024, a difference of 0.010%), Immigrants from Venezuela ($37,003, a difference of 0.040%), Dominican ($37,046, a difference of 0.070%), Immigrants from Belize ($37,056, a difference of 0.10%), and Salvadoran ($37,083, a difference of 0.18%).
| Demographics | Rating | Rank | Median Female Earnings |
| Malaysians | 0.7 /100 | #261 | Tragic $37,298 |
| Venezuelans | 0.7 /100 | #262 | Tragic $37,282 |
| German Russians | 0.5 /100 | #263 | Tragic $37,105 |
| Salvadorans | 0.4 /100 | #264 | Tragic $37,083 |
| Immigrants | Belize | 0.4 /100 | #265 | Tragic $37,056 |
| Dominicans | 0.4 /100 | #266 | Tragic $37,046 |
| Immigrants | Nonimmigrants | 0.4 /100 | #267 | Tragic $37,024 |
| Cree | 0.4 /100 | #268 | Tragic $37,018 |
| Immigrants | Venezuela | 0.4 /100 | #269 | Tragic $37,003 |
| French American Indians | 0.3 /100 | #270 | Tragic $36,920 |
| Nicaraguans | 0.3 /100 | #271 | Tragic $36,904 |
| Immigrants | Dominican Republic | 0.3 /100 | #272 | Tragic $36,857 |
| Immigrants | Laos | 0.3 /100 | #273 | Tragic $36,841 |
| Immigrants | El Salvador | 0.2 /100 | #274 | Tragic $36,673 |
| Africans | 0.1 /100 | #275 | Tragic $36,530 |
Demographics Similar to Immigrants from Netherlands by Median Female Earnings
In terms of median female earnings, the demographic groups most similar to Immigrants from Netherlands are Moroccan ($41,872, a difference of 0.0%), South African ($41,825, a difference of 0.11%), Immigrants from Hungary ($41,820, a difference of 0.12%), Immigrants from Grenada ($41,932, a difference of 0.15%), and Argentinean ($41,952, a difference of 0.20%).
| Demographics | Rating | Rank | Median Female Earnings |
| Immigrants | Northern Africa | 99.3 /100 | #88 | Exceptional $42,084 |
| Immigrants | Afghanistan | 99.3 /100 | #89 | Exceptional $42,055 |
| Ukrainians | 99.2 /100 | #90 | Exceptional $42,015 |
| Immigrants | Western Europe | 99.2 /100 | #91 | Exceptional $41,990 |
| Argentineans | 99.1 /100 | #92 | Exceptional $41,952 |
| Immigrants | Grenada | 99.0 /100 | #93 | Exceptional $41,932 |
| Moroccans | 98.9 /100 | #94 | Exceptional $41,872 |
| Immigrants | Netherlands | 98.9 /100 | #95 | Exceptional $41,870 |
| South Africans | 98.8 /100 | #96 | Exceptional $41,825 |
| Immigrants | Hungary | 98.8 /100 | #97 | Exceptional $41,820 |
| Immigrants | Scotland | 98.7 /100 | #98 | Exceptional $41,771 |
| Immigrants | Barbados | 98.4 /100 | #99 | Exceptional $41,685 |
| Romanians | 98.3 /100 | #100 | Exceptional $41,663 |
| Immigrants | Fiji | 98.3 /100 | #101 | Exceptional $41,656 |
| Immigrants | Poland | 98.2 /100 | #102 | Exceptional $41,630 |