Nepalese vs Immigrants Median Female Earnings
COMPARE
Nepalese
Immigrants
Median Female Earnings
Median Female Earnings Comparison
Nepalese
Immigrants
$38,603
MEDIAN FEMALE EARNINGS
9.3/ 100
METRIC RATING
219th/ 347
METRIC RANK
$39,328
MEDIAN FEMALE EARNINGS
31.7/ 100
METRIC RATING
192nd/ 347
METRIC RANK
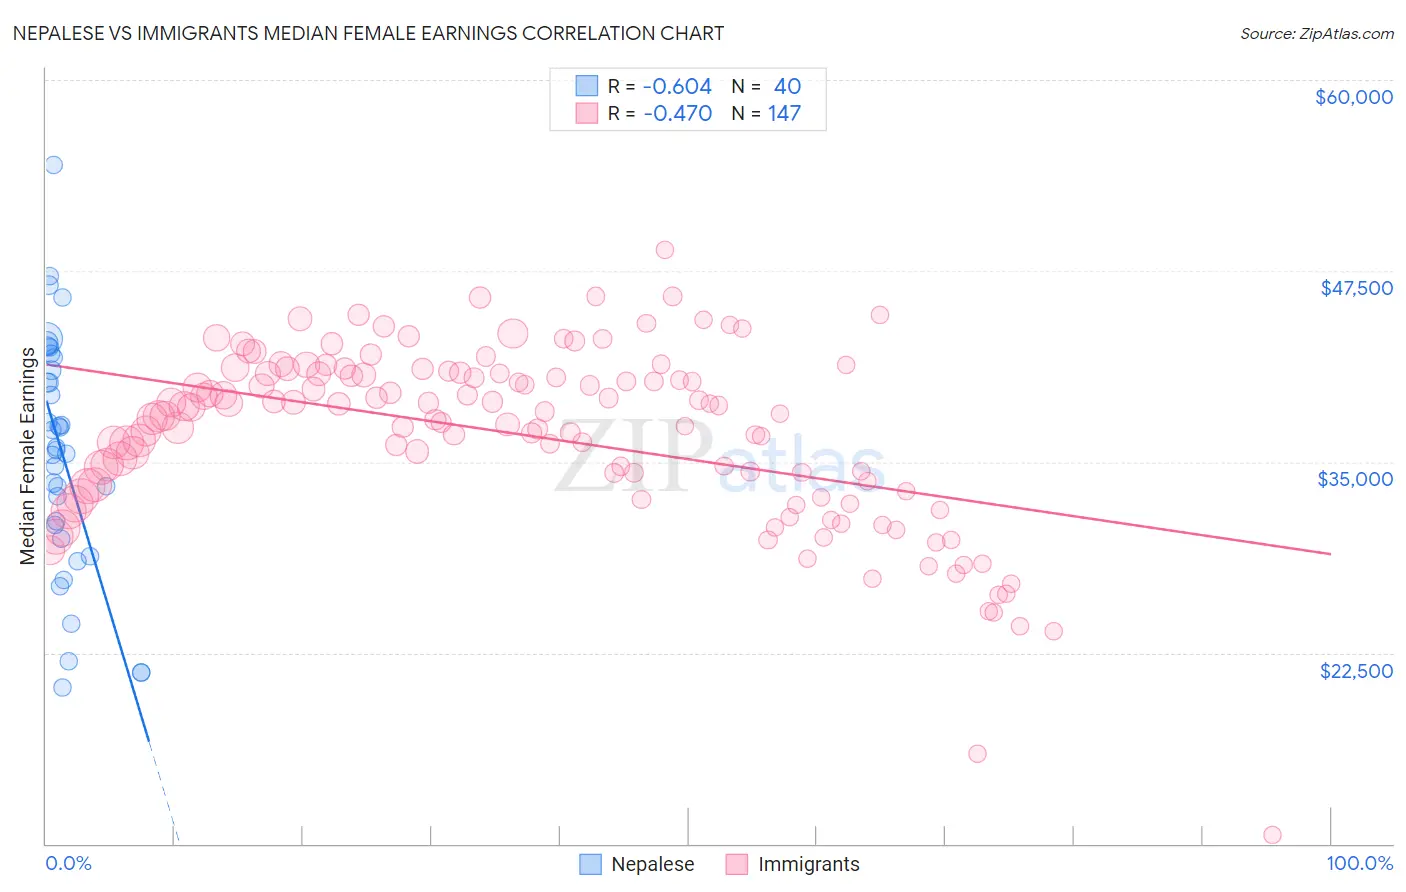
Nepalese vs Immigrants Median Female Earnings Correlation Chart
The statistical analysis conducted on geographies consisting of 24,521,755 people shows a significant negative correlation between the proportion of Nepalese and median female earnings in the United States with a correlation coefficient (R) of -0.604 and weighted average of $38,603. Similarly, the statistical analysis conducted on geographies consisting of 575,241,597 people shows a moderate negative correlation between the proportion of Immigrants and median female earnings in the United States with a correlation coefficient (R) of -0.470 and weighted average of $39,328, a difference of 1.9%.
Median Female Earnings Correlation Summary
| Measurement | Nepalese | Immigrants |
| Minimum | $20,210 | $10,532 |
| Maximum | $54,407 | $48,847 |
| Range | $34,197 | $38,315 |
| Mean | $35,483 | $36,737 |
| Median | $35,860 | $38,007 |
| Interquartile 25% (IQ1) | $30,426 | $33,067 |
| Interquartile 75% (IQ3) | $41,423 | $40,787 |
| Interquartile Range (IQR) | $10,997 | $7,720 |
| Standard Deviation (Sample) | $7,837 | $5,900 |
| Standard Deviation (Population) | $7,738 | $5,880 |
Similar Demographics by Median Female Earnings
Demographics Similar to Nepalese by Median Female Earnings
In terms of median female earnings, the demographic groups most similar to Nepalese are Cape Verdean ($38,614, a difference of 0.030%), Immigrants from Jamaica ($38,625, a difference of 0.060%), Yugoslavian ($38,573, a difference of 0.080%), Immigrants from the Azores ($38,573, a difference of 0.080%), and Immigrants from Ecuador ($38,644, a difference of 0.11%).
| Demographics | Rating | Rank | Median Female Earnings |
| Guamanians/Chamorros | 11.5 /100 | #212 | Poor $38,717 |
| Jamaicans | 10.5 /100 | #213 | Poor $38,670 |
| Iraqis | 10.5 /100 | #214 | Poor $38,666 |
| Spaniards | 10.3 /100 | #215 | Poor $38,656 |
| Immigrants | Ecuador | 10.1 /100 | #216 | Poor $38,644 |
| Immigrants | Jamaica | 9.7 /100 | #217 | Tragic $38,625 |
| Cape Verdeans | 9.5 /100 | #218 | Tragic $38,614 |
| Nepalese | 9.3 /100 | #219 | Tragic $38,603 |
| Yugoslavians | 8.8 /100 | #220 | Tragic $38,573 |
| Immigrants | Azores | 8.8 /100 | #221 | Tragic $38,573 |
| Japanese | 8.1 /100 | #222 | Tragic $38,528 |
| Immigrants | Sudan | 7.8 /100 | #223 | Tragic $38,511 |
| Native Hawaiians | 7.1 /100 | #224 | Tragic $38,461 |
| French | 7.0 /100 | #225 | Tragic $38,457 |
| French Canadians | 6.8 /100 | #226 | Tragic $38,436 |
Demographics Similar to Immigrants by Median Female Earnings
In terms of median female earnings, the demographic groups most similar to Immigrants are Immigrants from Western Africa ($39,351, a difference of 0.060%), Immigrants from Nigeria ($39,294, a difference of 0.090%), Irish ($39,291, a difference of 0.090%), Puget Sound Salish ($39,376, a difference of 0.12%), and Senegalese ($39,384, a difference of 0.14%).
| Demographics | Rating | Rank | Median Female Earnings |
| Immigrants | West Indies | 36.9 /100 | #185 | Fair $39,441 |
| Colombians | 36.9 /100 | #186 | Fair $39,439 |
| Swedes | 36.0 /100 | #187 | Fair $39,421 |
| Bermudans | 35.9 /100 | #188 | Fair $39,418 |
| Senegalese | 34.2 /100 | #189 | Fair $39,384 |
| Puget Sound Salish | 33.9 /100 | #190 | Fair $39,376 |
| Immigrants | Western Africa | 32.7 /100 | #191 | Fair $39,351 |
| Immigrants | Immigrants | 31.7 /100 | #192 | Fair $39,328 |
| Immigrants | Nigeria | 30.2 /100 | #193 | Fair $39,294 |
| Irish | 30.0 /100 | #194 | Fair $39,291 |
| Uruguayans | 27.3 /100 | #195 | Fair $39,228 |
| Immigrants | Costa Rica | 25.6 /100 | #196 | Fair $39,186 |
| Assyrians/Chaldeans/Syriacs | 24.6 /100 | #197 | Fair $39,159 |
| Ecuadorians | 23.0 /100 | #198 | Fair $39,117 |
| Icelanders | 22.7 /100 | #199 | Fair $39,109 |