Nepalese vs Belgian Median Female Earnings
COMPARE
Nepalese
Belgian
Median Female Earnings
Median Female Earnings Comparison
Nepalese
Belgians
$38,603
MEDIAN FEMALE EARNINGS
9.3/ 100
METRIC RATING
219th/ 347
METRIC RANK
$38,382
MEDIAN FEMALE EARNINGS
6.1/ 100
METRIC RATING
229th/ 347
METRIC RANK
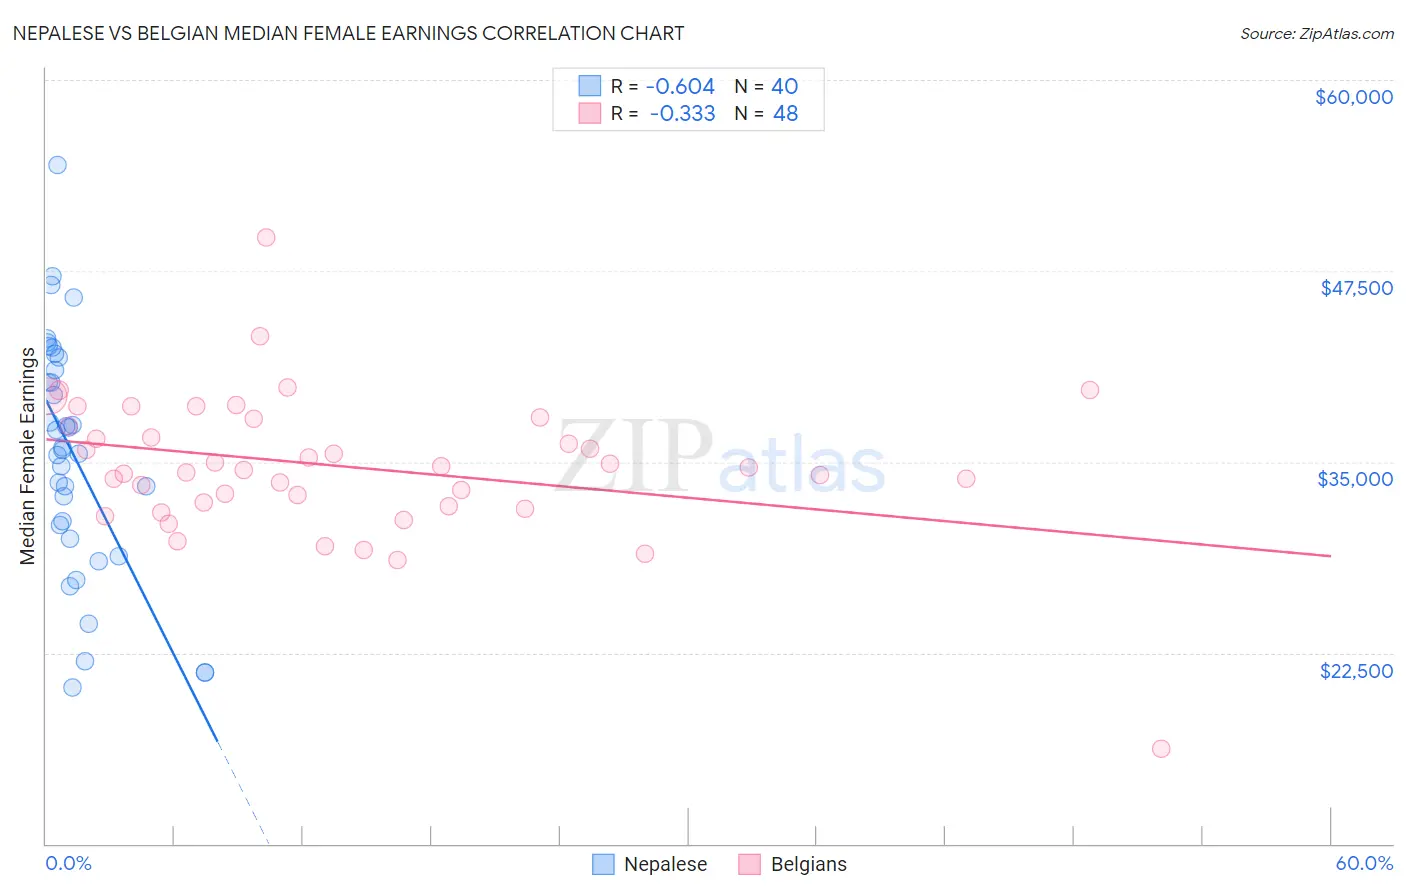
Nepalese vs Belgian Median Female Earnings Correlation Chart
The statistical analysis conducted on geographies consisting of 24,521,755 people shows a significant negative correlation between the proportion of Nepalese and median female earnings in the United States with a correlation coefficient (R) of -0.604 and weighted average of $38,603. Similarly, the statistical analysis conducted on geographies consisting of 355,862,311 people shows a mild negative correlation between the proportion of Belgians and median female earnings in the United States with a correlation coefficient (R) of -0.333 and weighted average of $38,382, a difference of 0.58%.
Median Female Earnings Correlation Summary
| Measurement | Nepalese | Belgian |
| Minimum | $20,210 | $16,250 |
| Maximum | $54,407 | $49,724 |
| Range | $34,197 | $33,474 |
| Mean | $35,483 | $34,687 |
| Median | $35,860 | $34,563 |
| Interquartile 25% (IQ1) | $30,426 | $32,227 |
| Interquartile 75% (IQ3) | $41,423 | $37,577 |
| Interquartile Range (IQR) | $10,997 | $5,350 |
| Standard Deviation (Sample) | $7,837 | $4,773 |
| Standard Deviation (Population) | $7,738 | $4,723 |
Demographics Similar to Nepalese and Belgians by Median Female Earnings
In terms of median female earnings, the demographic groups most similar to Nepalese are Cape Verdean ($38,614, a difference of 0.030%), Immigrants from Jamaica ($38,625, a difference of 0.060%), Yugoslavian ($38,573, a difference of 0.080%), Immigrants from the Azores ($38,573, a difference of 0.080%), and Immigrants from Ecuador ($38,644, a difference of 0.11%). Similarly, the demographic groups most similar to Belgians are Subsaharan African ($38,391, a difference of 0.020%), Scottish ($38,397, a difference of 0.040%), Basque ($38,352, a difference of 0.080%), Somali ($38,333, a difference of 0.13%), and French Canadian ($38,436, a difference of 0.14%).
| Demographics | Rating | Rank | Median Female Earnings |
| Iraqis | 10.5 /100 | #214 | Poor $38,666 |
| Spaniards | 10.3 /100 | #215 | Poor $38,656 |
| Immigrants | Ecuador | 10.1 /100 | #216 | Poor $38,644 |
| Immigrants | Jamaica | 9.7 /100 | #217 | Tragic $38,625 |
| Cape Verdeans | 9.5 /100 | #218 | Tragic $38,614 |
| Nepalese | 9.3 /100 | #219 | Tragic $38,603 |
| Yugoslavians | 8.8 /100 | #220 | Tragic $38,573 |
| Immigrants | Azores | 8.8 /100 | #221 | Tragic $38,573 |
| Japanese | 8.1 /100 | #222 | Tragic $38,528 |
| Immigrants | Sudan | 7.8 /100 | #223 | Tragic $38,511 |
| Native Hawaiians | 7.1 /100 | #224 | Tragic $38,461 |
| French | 7.0 /100 | #225 | Tragic $38,457 |
| French Canadians | 6.8 /100 | #226 | Tragic $38,436 |
| Scottish | 6.3 /100 | #227 | Tragic $38,397 |
| Sub-Saharan Africans | 6.2 /100 | #228 | Tragic $38,391 |
| Belgians | 6.1 /100 | #229 | Tragic $38,382 |
| Basques | 5.7 /100 | #230 | Tragic $38,352 |
| Somalis | 5.5 /100 | #231 | Tragic $38,333 |
| Scandinavians | 5.2 /100 | #232 | Tragic $38,306 |
| Tongans | 5.1 /100 | #233 | Tragic $38,288 |
| Celtics | 5.0 /100 | #234 | Tragic $38,283 |