Nepalese vs Immigrants from Netherlands College, 1 year or more
COMPARE
Nepalese
Immigrants from Netherlands
College, 1 year or more
College, 1 year or more Comparison
Nepalese
Immigrants from Netherlands
54.9%
COLLEGE, 1 YEAR OR MORE
0.3/ 100
METRIC RATING
259th/ 347
METRIC RANK
64.2%
COLLEGE, 1 YEAR OR MORE
99.8/ 100
METRIC RATING
52nd/ 347
METRIC RANK
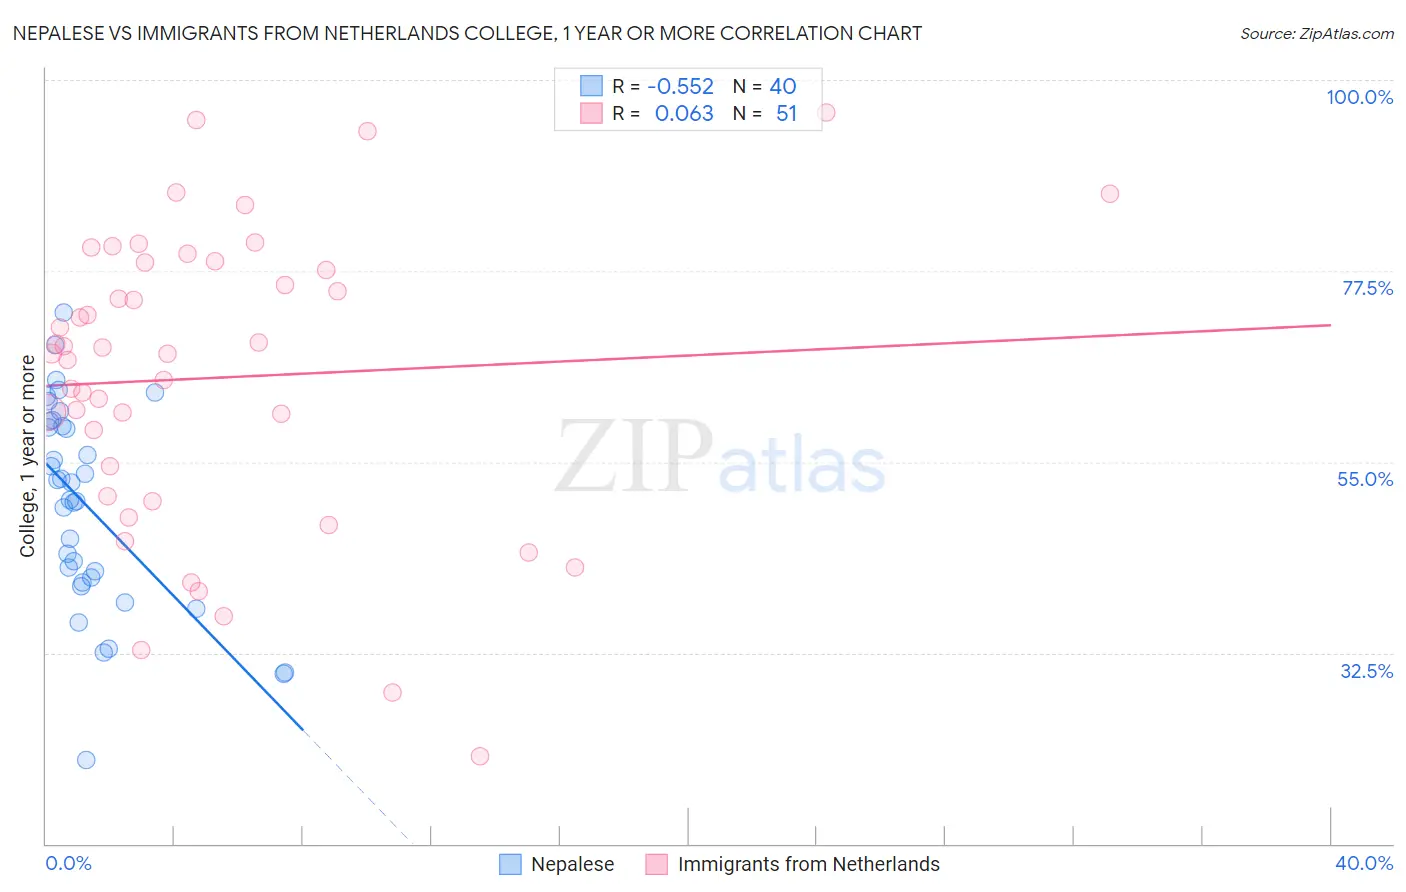
Nepalese vs Immigrants from Netherlands College, 1 year or more Correlation Chart
The statistical analysis conducted on geographies consisting of 24,521,755 people shows a substantial negative correlation between the proportion of Nepalese and percentage of population with at least college, 1 year or more education in the United States with a correlation coefficient (R) of -0.552 and weighted average of 54.9%. Similarly, the statistical analysis conducted on geographies consisting of 237,877,405 people shows a slight positive correlation between the proportion of Immigrants from Netherlands and percentage of population with at least college, 1 year or more education in the United States with a correlation coefficient (R) of 0.063 and weighted average of 64.2%, a difference of 16.9%.
College, 1 year or more Correlation Summary
| Measurement | Nepalese | Immigrants from Netherlands |
| Minimum | 19.8% | 20.3% |
| Maximum | 72.6% | 96.1% |
| Range | 52.8% | 75.8% |
| Mean | 49.8% | 64.9% |
| Median | 51.5% | 67.8% |
| Interquartile 25% (IQ1) | 41.1% | 51.0% |
| Interquartile 75% (IQ3) | 59.5% | 78.5% |
| Interquartile Range (IQR) | 18.5% | 27.5% |
| Standard Deviation (Sample) | 12.1% | 17.5% |
| Standard Deviation (Population) | 11.9% | 17.3% |
Similar Demographics by College, 1 year or more
Demographics Similar to Nepalese by College, 1 year or more
In terms of college, 1 year or more, the demographic groups most similar to Nepalese are African (55.0%, a difference of 0.060%), Jamaican (54.9%, a difference of 0.10%), Ottawa (54.9%, a difference of 0.13%), Immigrants from St. Vincent and the Grenadines (54.8%, a difference of 0.21%), and U.S. Virgin Islander (54.8%, a difference of 0.24%).
| Demographics | Rating | Rank | College, 1 year or more |
| Aleuts | 0.6 /100 | #252 | Tragic 55.4% |
| Immigrants | Barbados | 0.6 /100 | #253 | Tragic 55.4% |
| Japanese | 0.5 /100 | #254 | Tragic 55.2% |
| Immigrants | Bahamas | 0.5 /100 | #255 | Tragic 55.2% |
| Immigrants | West Indies | 0.5 /100 | #256 | Tragic 55.2% |
| Indonesians | 0.4 /100 | #257 | Tragic 55.1% |
| Africans | 0.4 /100 | #258 | Tragic 55.0% |
| Nepalese | 0.3 /100 | #259 | Tragic 54.9% |
| Jamaicans | 0.3 /100 | #260 | Tragic 54.9% |
| Ottawa | 0.3 /100 | #261 | Tragic 54.9% |
| Immigrants | St. Vincent and the Grenadines | 0.3 /100 | #262 | Tragic 54.8% |
| U.S. Virgin Islanders | 0.3 /100 | #263 | Tragic 54.8% |
| Immigrants | Micronesia | 0.3 /100 | #264 | Tragic 54.8% |
| Immigrants | Laos | 0.2 /100 | #265 | Tragic 54.7% |
| Potawatomi | 0.2 /100 | #266 | Tragic 54.6% |
Demographics Similar to Immigrants from Netherlands by College, 1 year or more
In terms of college, 1 year or more, the demographic groups most similar to Immigrants from Netherlands are Asian (64.2%, a difference of 0.020%), Zimbabwean (64.2%, a difference of 0.050%), Immigrants from Malaysia (64.3%, a difference of 0.16%), Immigrants from Belarus (64.1%, a difference of 0.17%), and Immigrants from Czechoslovakia (64.1%, a difference of 0.20%).
| Demographics | Rating | Rank | College, 1 year or more |
| Immigrants | Lithuania | 99.9 /100 | #45 | Exceptional 64.6% |
| Bhutanese | 99.9 /100 | #46 | Exceptional 64.6% |
| Australians | 99.9 /100 | #47 | Exceptional 64.6% |
| Immigrants | Bulgaria | 99.9 /100 | #48 | Exceptional 64.6% |
| New Zealanders | 99.9 /100 | #49 | Exceptional 64.6% |
| Immigrants | Austria | 99.8 /100 | #50 | Exceptional 64.4% |
| Immigrants | Malaysia | 99.8 /100 | #51 | Exceptional 64.3% |
| Immigrants | Netherlands | 99.8 /100 | #52 | Exceptional 64.2% |
| Asians | 99.8 /100 | #53 | Exceptional 64.2% |
| Zimbabweans | 99.8 /100 | #54 | Exceptional 64.2% |
| Immigrants | Belarus | 99.7 /100 | #55 | Exceptional 64.1% |
| Immigrants | Czechoslovakia | 99.7 /100 | #56 | Exceptional 64.1% |
| South Africans | 99.7 /100 | #57 | Exceptional 64.1% |
| Immigrants | Asia | 99.7 /100 | #58 | Exceptional 64.0% |
| Immigrants | Serbia | 99.6 /100 | #59 | Exceptional 63.8% |