Immigrants from Burma/Myanmar vs Immigrants from Netherlands Median Female Earnings
COMPARE
Immigrants from Burma/Myanmar
Immigrants from Netherlands
Median Female Earnings
Median Female Earnings Comparison
Immigrants from Burma/Myanmar
Immigrants from Netherlands
$38,028
MEDIAN FEMALE EARNINGS
3.0/ 100
METRIC RATING
242nd/ 347
METRIC RANK
$41,870
MEDIAN FEMALE EARNINGS
98.9/ 100
METRIC RATING
95th/ 347
METRIC RANK
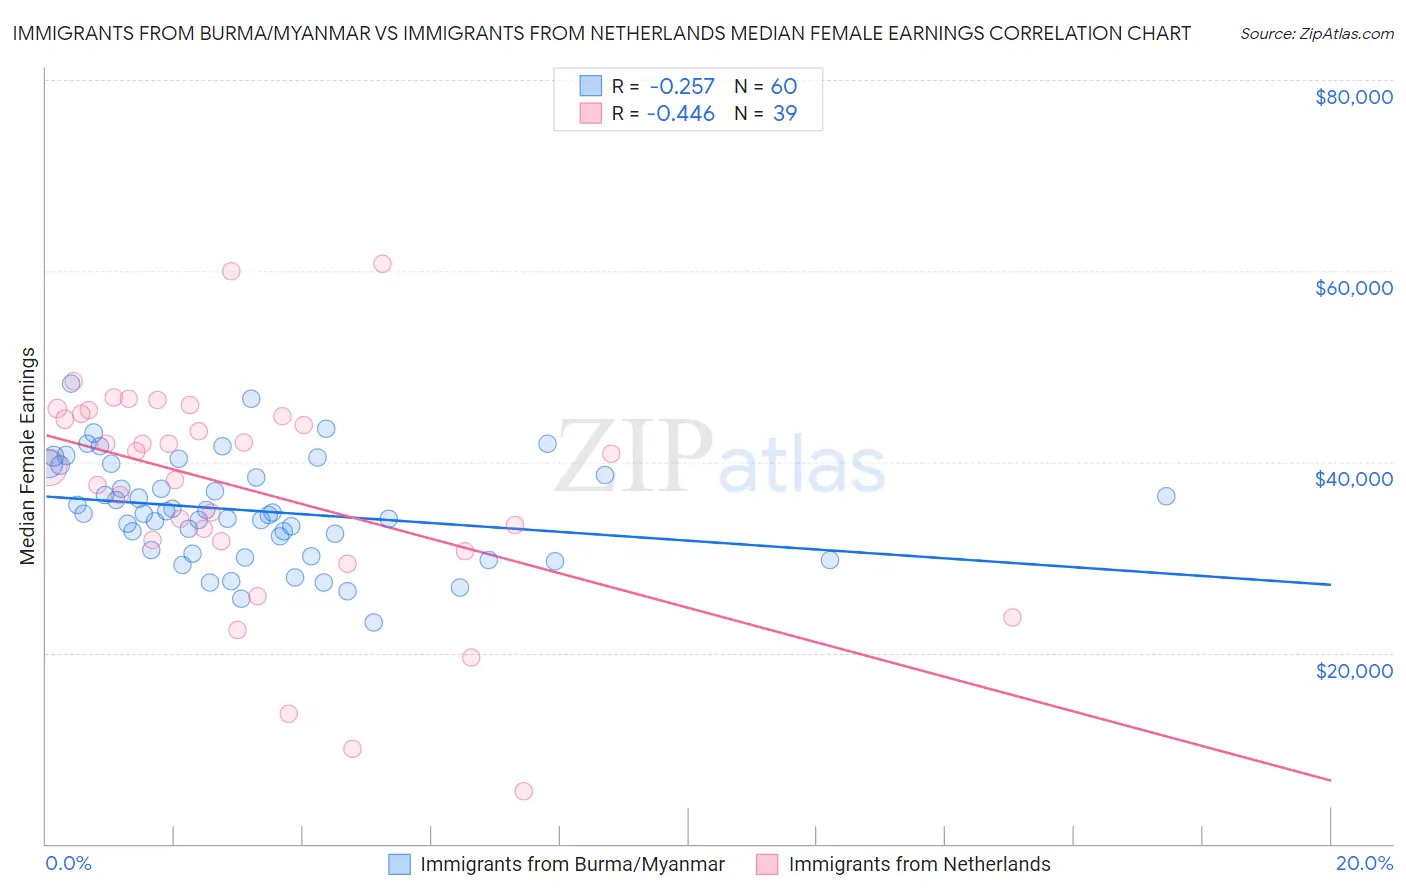
Immigrants from Burma/Myanmar vs Immigrants from Netherlands Median Female Earnings Correlation Chart
The statistical analysis conducted on geographies consisting of 172,347,432 people shows a weak negative correlation between the proportion of Immigrants from Burma/Myanmar and median female earnings in the United States with a correlation coefficient (R) of -0.257 and weighted average of $38,028. Similarly, the statistical analysis conducted on geographies consisting of 237,807,250 people shows a moderate negative correlation between the proportion of Immigrants from Netherlands and median female earnings in the United States with a correlation coefficient (R) of -0.446 and weighted average of $41,870, a difference of 10.1%.
Median Female Earnings Correlation Summary
| Measurement | Immigrants from Burma/Myanmar | Immigrants from Netherlands |
| Minimum | $23,125 | $5,512 |
| Maximum | $48,239 | $60,703 |
| Range | $25,114 | $55,191 |
| Mean | $34,892 | $37,129 |
| Median | $34,545 | $40,875 |
| Interquartile 25% (IQ1) | $30,606 | $31,744 |
| Interquartile 75% (IQ3) | $39,132 | $45,060 |
| Interquartile Range (IQR) | $8,525 | $13,315 |
| Standard Deviation (Sample) | $5,366 | $11,943 |
| Standard Deviation (Population) | $5,321 | $11,789 |
Similar Demographics by Median Female Earnings
Demographics Similar to Immigrants from Burma/Myanmar by Median Female Earnings
In terms of median female earnings, the demographic groups most similar to Immigrants from Burma/Myanmar are German ($37,986, a difference of 0.11%), Immigrants from Liberia ($37,970, a difference of 0.15%), Immigrants from Middle Africa ($37,965, a difference of 0.17%), Delaware ($37,964, a difference of 0.17%), and Spanish ($38,098, a difference of 0.18%).
| Demographics | Rating | Rank | Median Female Earnings |
| Sudanese | 4.4 /100 | #235 | Tragic $38,215 |
| Liberians | 4.4 /100 | #236 | Tragic $38,215 |
| Immigrants | Cabo Verde | 4.3 /100 | #237 | Tragic $38,208 |
| Alaska Natives | 4.3 /100 | #238 | Tragic $38,202 |
| English | 4.2 /100 | #239 | Tragic $38,196 |
| Finns | 4.0 /100 | #240 | Tragic $38,173 |
| Spanish | 3.5 /100 | #241 | Tragic $38,098 |
| Immigrants | Burma/Myanmar | 3.0 /100 | #242 | Tragic $38,028 |
| Germans | 2.8 /100 | #243 | Tragic $37,986 |
| Immigrants | Liberia | 2.7 /100 | #244 | Tragic $37,970 |
| Immigrants | Middle Africa | 2.7 /100 | #245 | Tragic $37,965 |
| Delaware | 2.6 /100 | #246 | Tragic $37,964 |
| Immigrants | Somalia | 2.4 /100 | #247 | Tragic $37,914 |
| Alaskan Athabascans | 2.3 /100 | #248 | Tragic $37,905 |
| Swiss | 2.3 /100 | #249 | Tragic $37,904 |
Demographics Similar to Immigrants from Netherlands by Median Female Earnings
In terms of median female earnings, the demographic groups most similar to Immigrants from Netherlands are Moroccan ($41,872, a difference of 0.0%), South African ($41,825, a difference of 0.11%), Immigrants from Hungary ($41,820, a difference of 0.12%), Immigrants from Grenada ($41,932, a difference of 0.15%), and Argentinean ($41,952, a difference of 0.20%).
| Demographics | Rating | Rank | Median Female Earnings |
| Immigrants | Northern Africa | 99.3 /100 | #88 | Exceptional $42,084 |
| Immigrants | Afghanistan | 99.3 /100 | #89 | Exceptional $42,055 |
| Ukrainians | 99.2 /100 | #90 | Exceptional $42,015 |
| Immigrants | Western Europe | 99.2 /100 | #91 | Exceptional $41,990 |
| Argentineans | 99.1 /100 | #92 | Exceptional $41,952 |
| Immigrants | Grenada | 99.0 /100 | #93 | Exceptional $41,932 |
| Moroccans | 98.9 /100 | #94 | Exceptional $41,872 |
| Immigrants | Netherlands | 98.9 /100 | #95 | Exceptional $41,870 |
| South Africans | 98.8 /100 | #96 | Exceptional $41,825 |
| Immigrants | Hungary | 98.8 /100 | #97 | Exceptional $41,820 |
| Immigrants | Scotland | 98.7 /100 | #98 | Exceptional $41,771 |
| Immigrants | Barbados | 98.4 /100 | #99 | Exceptional $41,685 |
| Romanians | 98.3 /100 | #100 | Exceptional $41,663 |
| Immigrants | Fiji | 98.3 /100 | #101 | Exceptional $41,656 |
| Immigrants | Poland | 98.2 /100 | #102 | Exceptional $41,630 |