South African vs Immigrants from Netherlands Median Female Earnings
COMPARE
South African
Immigrants from Netherlands
Median Female Earnings
Median Female Earnings Comparison
South Africans
Immigrants from Netherlands
$41,825
MEDIAN FEMALE EARNINGS
98.8/ 100
METRIC RATING
96th/ 347
METRIC RANK
$41,870
MEDIAN FEMALE EARNINGS
98.9/ 100
METRIC RATING
95th/ 347
METRIC RANK
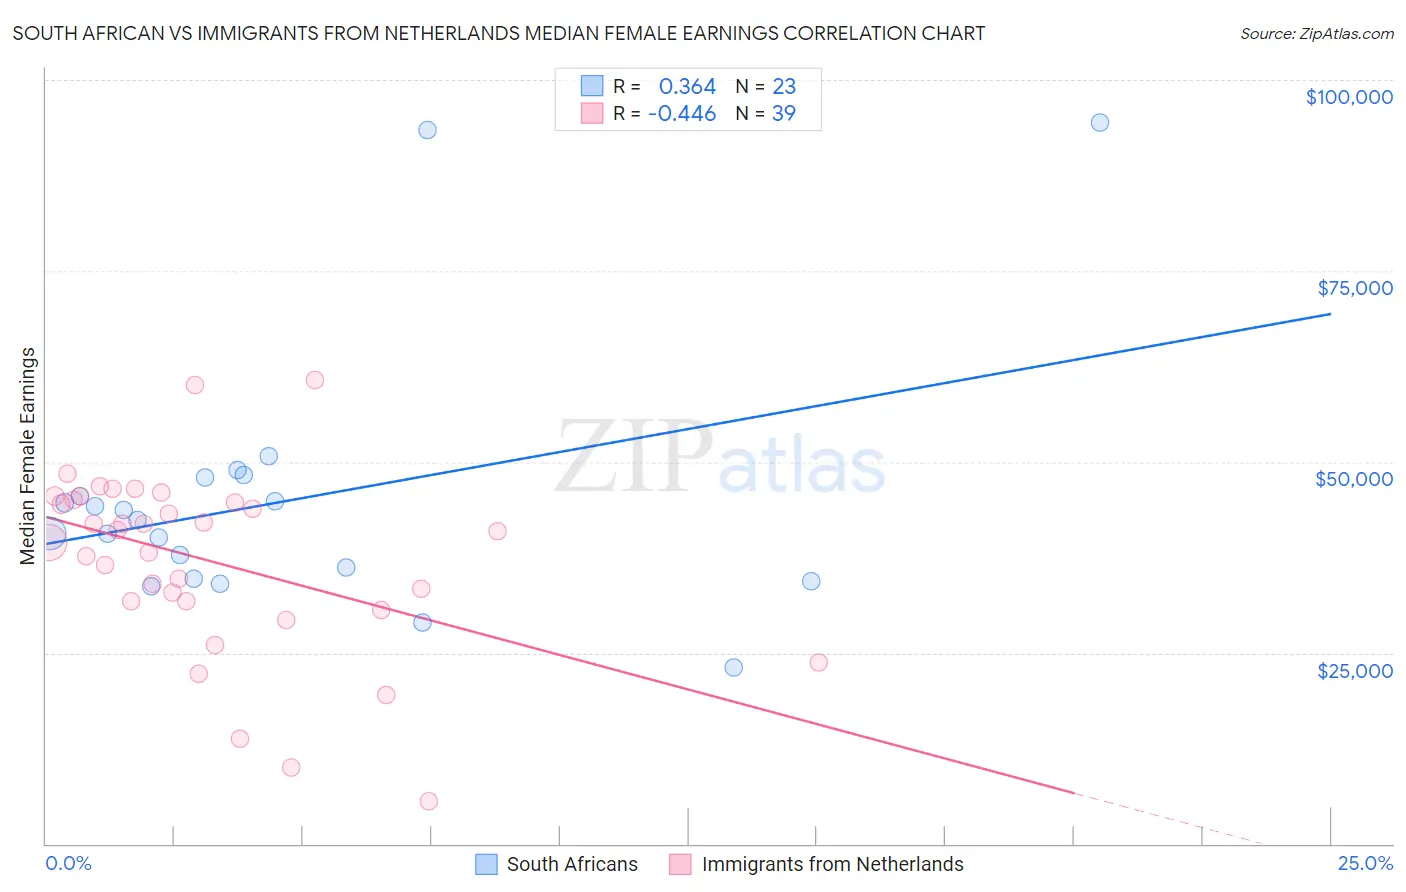
South African vs Immigrants from Netherlands Median Female Earnings Correlation Chart
The statistical analysis conducted on geographies consisting of 182,555,636 people shows a mild positive correlation between the proportion of South Africans and median female earnings in the United States with a correlation coefficient (R) of 0.364 and weighted average of $41,825. Similarly, the statistical analysis conducted on geographies consisting of 237,807,250 people shows a moderate negative correlation between the proportion of Immigrants from Netherlands and median female earnings in the United States with a correlation coefficient (R) of -0.446 and weighted average of $41,870, a difference of 0.11%.
Median Female Earnings Correlation Summary
| Measurement | South African | Immigrants from Netherlands |
| Minimum | $23,068 | $5,512 |
| Maximum | $94,510 | $60,703 |
| Range | $71,442 | $55,191 |
| Mean | $44,927 | $37,129 |
| Median | $42,310 | $40,875 |
| Interquartile 25% (IQ1) | $34,713 | $31,744 |
| Interquartile 75% (IQ3) | $47,886 | $45,060 |
| Interquartile Range (IQR) | $13,173 | $13,315 |
| Standard Deviation (Sample) | $16,884 | $11,943 |
| Standard Deviation (Population) | $16,513 | $11,789 |
Demographics Similar to South Africans and Immigrants from Netherlands by Median Female Earnings
In terms of median female earnings, the demographic groups most similar to South Africans are Immigrants from Hungary ($41,820, a difference of 0.010%), Moroccan ($41,872, a difference of 0.11%), Immigrants from Scotland ($41,771, a difference of 0.13%), Immigrants from Grenada ($41,932, a difference of 0.26%), and Argentinean ($41,952, a difference of 0.30%). Similarly, the demographic groups most similar to Immigrants from Netherlands are Moroccan ($41,872, a difference of 0.0%), Immigrants from Hungary ($41,820, a difference of 0.12%), Immigrants from Grenada ($41,932, a difference of 0.15%), Argentinean ($41,952, a difference of 0.20%), and Immigrants from Scotland ($41,771, a difference of 0.24%).
| Demographics | Rating | Rank | Median Female Earnings |
| Laotians | 99.4 /100 | #85 | Exceptional $42,133 |
| Immigrants | St. Vincent and the Grenadines | 99.3 /100 | #86 | Exceptional $42,108 |
| Lithuanians | 99.3 /100 | #87 | Exceptional $42,108 |
| Immigrants | Northern Africa | 99.3 /100 | #88 | Exceptional $42,084 |
| Immigrants | Afghanistan | 99.3 /100 | #89 | Exceptional $42,055 |
| Ukrainians | 99.2 /100 | #90 | Exceptional $42,015 |
| Immigrants | Western Europe | 99.2 /100 | #91 | Exceptional $41,990 |
| Argentineans | 99.1 /100 | #92 | Exceptional $41,952 |
| Immigrants | Grenada | 99.0 /100 | #93 | Exceptional $41,932 |
| Moroccans | 98.9 /100 | #94 | Exceptional $41,872 |
| Immigrants | Netherlands | 98.9 /100 | #95 | Exceptional $41,870 |
| South Africans | 98.8 /100 | #96 | Exceptional $41,825 |
| Immigrants | Hungary | 98.8 /100 | #97 | Exceptional $41,820 |
| Immigrants | Scotland | 98.7 /100 | #98 | Exceptional $41,771 |
| Immigrants | Barbados | 98.4 /100 | #99 | Exceptional $41,685 |
| Romanians | 98.3 /100 | #100 | Exceptional $41,663 |
| Immigrants | Fiji | 98.3 /100 | #101 | Exceptional $41,656 |
| Immigrants | Poland | 98.2 /100 | #102 | Exceptional $41,630 |
| Immigrants | Argentina | 97.9 /100 | #103 | Exceptional $41,554 |
| Immigrants | Zimbabwe | 97.8 /100 | #104 | Exceptional $41,527 |
| Italians | 97.7 /100 | #105 | Exceptional $41,505 |