Scandinavian vs Immigrants from Netherlands Median Female Earnings
COMPARE
Scandinavian
Immigrants from Netherlands
Median Female Earnings
Median Female Earnings Comparison
Scandinavians
Immigrants from Netherlands
$38,306
MEDIAN FEMALE EARNINGS
5.2/ 100
METRIC RATING
232nd/ 347
METRIC RANK
$41,870
MEDIAN FEMALE EARNINGS
98.9/ 100
METRIC RATING
95th/ 347
METRIC RANK
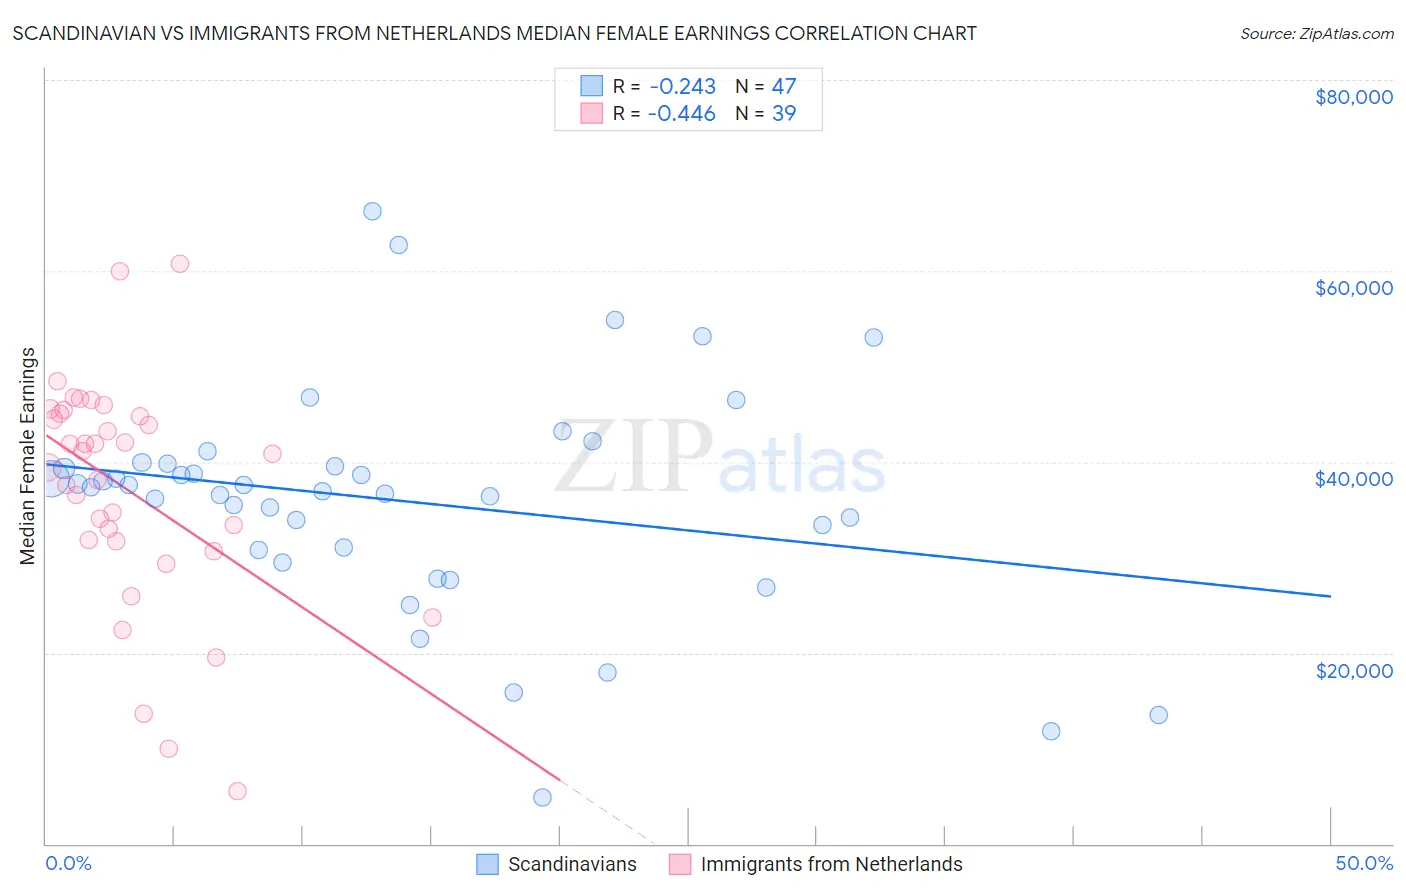
Scandinavian vs Immigrants from Netherlands Median Female Earnings Correlation Chart
The statistical analysis conducted on geographies consisting of 472,085,070 people shows a weak negative correlation between the proportion of Scandinavians and median female earnings in the United States with a correlation coefficient (R) of -0.243 and weighted average of $38,306. Similarly, the statistical analysis conducted on geographies consisting of 237,807,250 people shows a moderate negative correlation between the proportion of Immigrants from Netherlands and median female earnings in the United States with a correlation coefficient (R) of -0.446 and weighted average of $41,870, a difference of 9.3%.
Median Female Earnings Correlation Summary
| Measurement | Scandinavian | Immigrants from Netherlands |
| Minimum | $4,824 | $5,512 |
| Maximum | $66,207 | $60,703 |
| Range | $61,383 | $55,191 |
| Mean | $35,901 | $37,129 |
| Median | $37,378 | $40,875 |
| Interquartile 25% (IQ1) | $30,708 | $31,744 |
| Interquartile 75% (IQ3) | $39,798 | $45,060 |
| Interquartile Range (IQR) | $9,090 | $13,315 |
| Standard Deviation (Sample) | $11,858 | $11,943 |
| Standard Deviation (Population) | $11,731 | $11,789 |
Similar Demographics by Median Female Earnings
Demographics Similar to Scandinavians by Median Female Earnings
In terms of median female earnings, the demographic groups most similar to Scandinavians are Tongan ($38,288, a difference of 0.050%), Celtic ($38,283, a difference of 0.060%), Somali ($38,333, a difference of 0.070%), Basque ($38,352, a difference of 0.12%), and Belgian ($38,382, a difference of 0.20%).
| Demographics | Rating | Rank | Median Female Earnings |
| French | 7.0 /100 | #225 | Tragic $38,457 |
| French Canadians | 6.8 /100 | #226 | Tragic $38,436 |
| Scottish | 6.3 /100 | #227 | Tragic $38,397 |
| Sub-Saharan Africans | 6.2 /100 | #228 | Tragic $38,391 |
| Belgians | 6.1 /100 | #229 | Tragic $38,382 |
| Basques | 5.7 /100 | #230 | Tragic $38,352 |
| Somalis | 5.5 /100 | #231 | Tragic $38,333 |
| Scandinavians | 5.2 /100 | #232 | Tragic $38,306 |
| Tongans | 5.1 /100 | #233 | Tragic $38,288 |
| Celtics | 5.0 /100 | #234 | Tragic $38,283 |
| Sudanese | 4.4 /100 | #235 | Tragic $38,215 |
| Liberians | 4.4 /100 | #236 | Tragic $38,215 |
| Immigrants | Cabo Verde | 4.3 /100 | #237 | Tragic $38,208 |
| Alaska Natives | 4.3 /100 | #238 | Tragic $38,202 |
| English | 4.2 /100 | #239 | Tragic $38,196 |
Demographics Similar to Immigrants from Netherlands by Median Female Earnings
In terms of median female earnings, the demographic groups most similar to Immigrants from Netherlands are Moroccan ($41,872, a difference of 0.0%), South African ($41,825, a difference of 0.11%), Immigrants from Hungary ($41,820, a difference of 0.12%), Immigrants from Grenada ($41,932, a difference of 0.15%), and Argentinean ($41,952, a difference of 0.20%).
| Demographics | Rating | Rank | Median Female Earnings |
| Immigrants | Northern Africa | 99.3 /100 | #88 | Exceptional $42,084 |
| Immigrants | Afghanistan | 99.3 /100 | #89 | Exceptional $42,055 |
| Ukrainians | 99.2 /100 | #90 | Exceptional $42,015 |
| Immigrants | Western Europe | 99.2 /100 | #91 | Exceptional $41,990 |
| Argentineans | 99.1 /100 | #92 | Exceptional $41,952 |
| Immigrants | Grenada | 99.0 /100 | #93 | Exceptional $41,932 |
| Moroccans | 98.9 /100 | #94 | Exceptional $41,872 |
| Immigrants | Netherlands | 98.9 /100 | #95 | Exceptional $41,870 |
| South Africans | 98.8 /100 | #96 | Exceptional $41,825 |
| Immigrants | Hungary | 98.8 /100 | #97 | Exceptional $41,820 |
| Immigrants | Scotland | 98.7 /100 | #98 | Exceptional $41,771 |
| Immigrants | Barbados | 98.4 /100 | #99 | Exceptional $41,685 |
| Romanians | 98.3 /100 | #100 | Exceptional $41,663 |
| Immigrants | Fiji | 98.3 /100 | #101 | Exceptional $41,656 |
| Immigrants | Poland | 98.2 /100 | #102 | Exceptional $41,630 |