Inupiat vs Immigrants from Netherlands Median Female Earnings
COMPARE
Inupiat
Immigrants from Netherlands
Median Female Earnings
Median Female Earnings Comparison
Inupiat
Immigrants from Netherlands
$40,080
MEDIAN FEMALE EARNINGS
68.9/ 100
METRIC RATING
160th/ 347
METRIC RANK
$41,870
MEDIAN FEMALE EARNINGS
98.9/ 100
METRIC RATING
95th/ 347
METRIC RANK
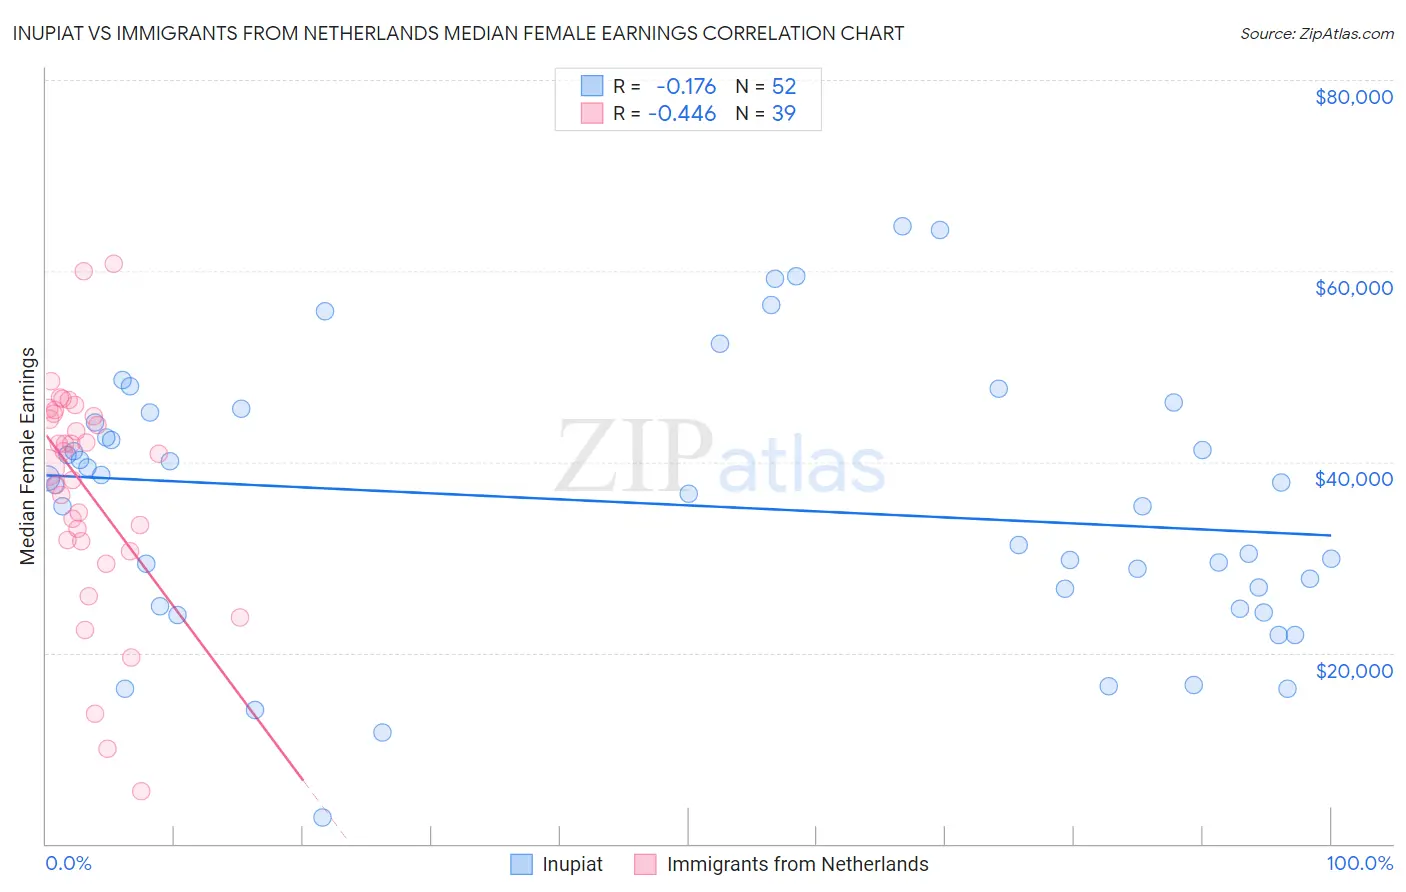
Inupiat vs Immigrants from Netherlands Median Female Earnings Correlation Chart
The statistical analysis conducted on geographies consisting of 96,311,190 people shows a poor negative correlation between the proportion of Inupiat and median female earnings in the United States with a correlation coefficient (R) of -0.176 and weighted average of $40,080. Similarly, the statistical analysis conducted on geographies consisting of 237,807,250 people shows a moderate negative correlation between the proportion of Immigrants from Netherlands and median female earnings in the United States with a correlation coefficient (R) of -0.446 and weighted average of $41,870, a difference of 4.5%.
Median Female Earnings Correlation Summary
| Measurement | Inupiat | Immigrants from Netherlands |
| Minimum | $2,800 | $5,512 |
| Maximum | $64,688 | $60,703 |
| Range | $61,888 | $55,191 |
| Mean | $35,589 | $37,129 |
| Median | $37,155 | $40,875 |
| Interquartile 25% (IQ1) | $25,800 | $31,744 |
| Interquartile 75% (IQ3) | $44,695 | $45,060 |
| Interquartile Range (IQR) | $18,895 | $13,315 |
| Standard Deviation (Sample) | $13,962 | $11,943 |
| Standard Deviation (Population) | $13,827 | $11,789 |
Similar Demographics by Median Female Earnings
Demographics Similar to Inupiat by Median Female Earnings
In terms of median female earnings, the demographic groups most similar to Inupiat are Alsatian ($40,060, a difference of 0.050%), South American Indian ($40,019, a difference of 0.15%), Immigrants from Vietnam ($40,153, a difference of 0.18%), Lebanese ($40,006, a difference of 0.18%), and Immigrants from Senegal ($40,157, a difference of 0.19%).
| Demographics | Rating | Rank | Median Female Earnings |
| British West Indians | 77.7 /100 | #153 | Good $40,299 |
| Immigrants | Oceania | 77.6 /100 | #154 | Good $40,297 |
| Immigrants | Africa | 76.2 /100 | #155 | Good $40,257 |
| Peruvians | 75.3 /100 | #156 | Good $40,234 |
| Portuguese | 73.0 /100 | #157 | Good $40,177 |
| Immigrants | Senegal | 72.2 /100 | #158 | Good $40,157 |
| Immigrants | Vietnam | 72.0 /100 | #159 | Good $40,153 |
| Inupiat | 68.9 /100 | #160 | Good $40,080 |
| Alsatians | 68.0 /100 | #161 | Good $40,060 |
| South American Indians | 66.1 /100 | #162 | Good $40,019 |
| Lebanese | 65.5 /100 | #163 | Good $40,006 |
| Immigrants | Saudi Arabia | 62.9 /100 | #164 | Good $39,952 |
| Immigrants | Bangladesh | 60.8 /100 | #165 | Good $39,910 |
| Immigrants | Ghana | 60.0 /100 | #166 | Good $39,894 |
| Luxembourgers | 59.9 /100 | #167 | Average $39,891 |
Demographics Similar to Immigrants from Netherlands by Median Female Earnings
In terms of median female earnings, the demographic groups most similar to Immigrants from Netherlands are Moroccan ($41,872, a difference of 0.0%), South African ($41,825, a difference of 0.11%), Immigrants from Hungary ($41,820, a difference of 0.12%), Immigrants from Grenada ($41,932, a difference of 0.15%), and Argentinean ($41,952, a difference of 0.20%).
| Demographics | Rating | Rank | Median Female Earnings |
| Immigrants | Northern Africa | 99.3 /100 | #88 | Exceptional $42,084 |
| Immigrants | Afghanistan | 99.3 /100 | #89 | Exceptional $42,055 |
| Ukrainians | 99.2 /100 | #90 | Exceptional $42,015 |
| Immigrants | Western Europe | 99.2 /100 | #91 | Exceptional $41,990 |
| Argentineans | 99.1 /100 | #92 | Exceptional $41,952 |
| Immigrants | Grenada | 99.0 /100 | #93 | Exceptional $41,932 |
| Moroccans | 98.9 /100 | #94 | Exceptional $41,872 |
| Immigrants | Netherlands | 98.9 /100 | #95 | Exceptional $41,870 |
| South Africans | 98.8 /100 | #96 | Exceptional $41,825 |
| Immigrants | Hungary | 98.8 /100 | #97 | Exceptional $41,820 |
| Immigrants | Scotland | 98.7 /100 | #98 | Exceptional $41,771 |
| Immigrants | Barbados | 98.4 /100 | #99 | Exceptional $41,685 |
| Romanians | 98.3 /100 | #100 | Exceptional $41,663 |
| Immigrants | Fiji | 98.3 /100 | #101 | Exceptional $41,656 |
| Immigrants | Poland | 98.2 /100 | #102 | Exceptional $41,630 |