Nepalese vs Osage Median Female Earnings
COMPARE
Nepalese
Osage
Median Female Earnings
Median Female Earnings Comparison
Nepalese
Osage
$38,603
MEDIAN FEMALE EARNINGS
9.3/ 100
METRIC RATING
219th/ 347
METRIC RANK
$36,034
MEDIAN FEMALE EARNINGS
0.0/ 100
METRIC RATING
286th/ 347
METRIC RANK
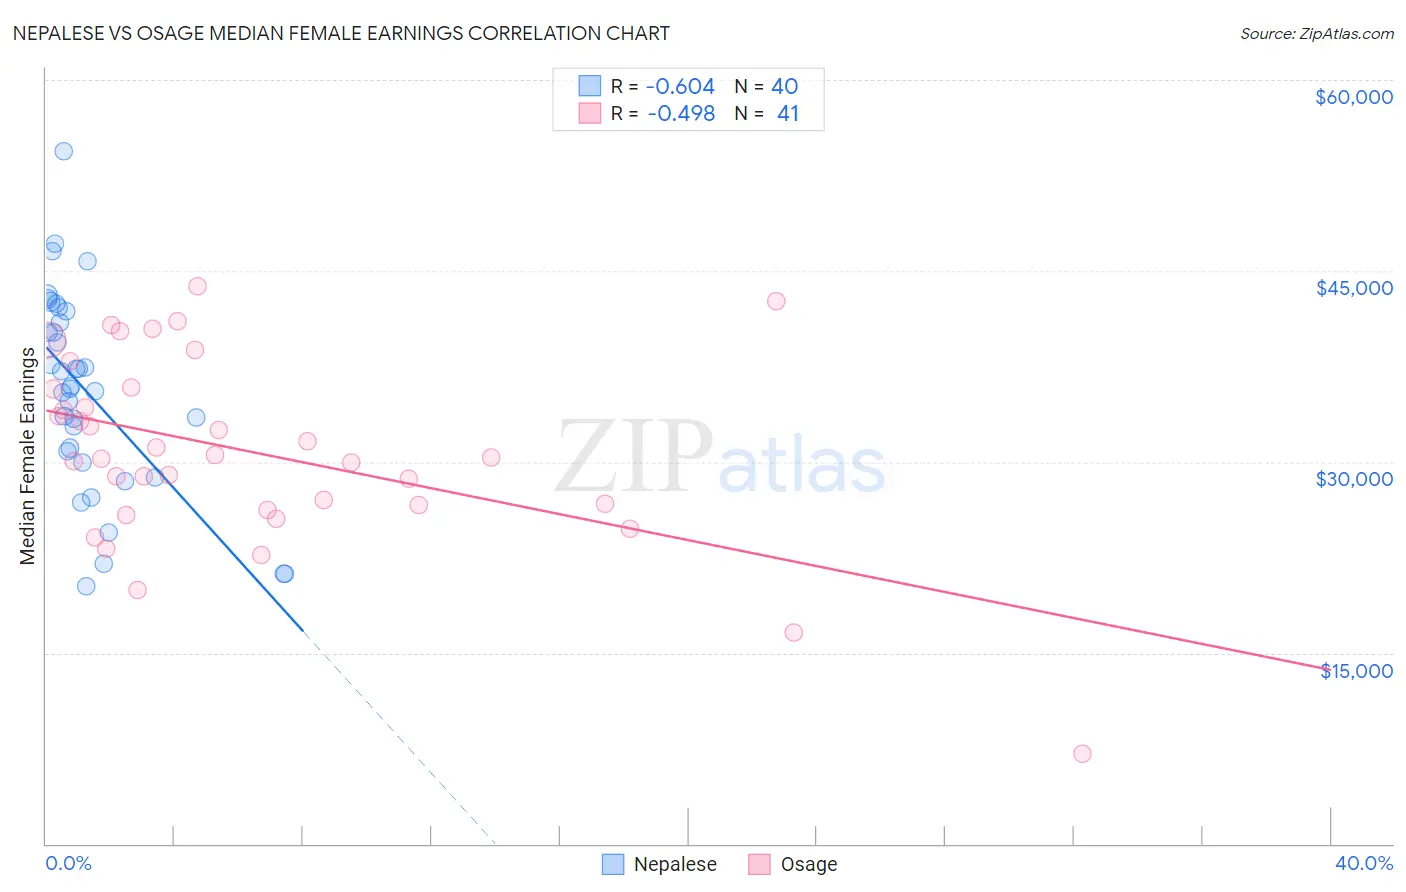
Nepalese vs Osage Median Female Earnings Correlation Chart
The statistical analysis conducted on geographies consisting of 24,521,755 people shows a significant negative correlation between the proportion of Nepalese and median female earnings in the United States with a correlation coefficient (R) of -0.604 and weighted average of $38,603. Similarly, the statistical analysis conducted on geographies consisting of 91,783,866 people shows a moderate negative correlation between the proportion of Osage and median female earnings in the United States with a correlation coefficient (R) of -0.498 and weighted average of $36,034, a difference of 7.1%.
Median Female Earnings Correlation Summary
| Measurement | Nepalese | Osage |
| Minimum | $20,210 | $7,083 |
| Maximum | $54,407 | $43,750 |
| Range | $34,197 | $36,667 |
| Mean | $35,483 | $30,795 |
| Median | $35,860 | $30,332 |
| Interquartile 25% (IQ1) | $30,426 | $26,425 |
| Interquartile 75% (IQ3) | $41,423 | $35,787 |
| Interquartile Range (IQR) | $10,997 | $9,362 |
| Standard Deviation (Sample) | $7,837 | $7,435 |
| Standard Deviation (Population) | $7,738 | $7,343 |
Similar Demographics by Median Female Earnings
Demographics Similar to Nepalese by Median Female Earnings
In terms of median female earnings, the demographic groups most similar to Nepalese are Cape Verdean ($38,614, a difference of 0.030%), Immigrants from Jamaica ($38,625, a difference of 0.060%), Yugoslavian ($38,573, a difference of 0.080%), Immigrants from the Azores ($38,573, a difference of 0.080%), and Immigrants from Ecuador ($38,644, a difference of 0.11%).
| Demographics | Rating | Rank | Median Female Earnings |
| Guamanians/Chamorros | 11.5 /100 | #212 | Poor $38,717 |
| Jamaicans | 10.5 /100 | #213 | Poor $38,670 |
| Iraqis | 10.5 /100 | #214 | Poor $38,666 |
| Spaniards | 10.3 /100 | #215 | Poor $38,656 |
| Immigrants | Ecuador | 10.1 /100 | #216 | Poor $38,644 |
| Immigrants | Jamaica | 9.7 /100 | #217 | Tragic $38,625 |
| Cape Verdeans | 9.5 /100 | #218 | Tragic $38,614 |
| Nepalese | 9.3 /100 | #219 | Tragic $38,603 |
| Yugoslavians | 8.8 /100 | #220 | Tragic $38,573 |
| Immigrants | Azores | 8.8 /100 | #221 | Tragic $38,573 |
| Japanese | 8.1 /100 | #222 | Tragic $38,528 |
| Immigrants | Sudan | 7.8 /100 | #223 | Tragic $38,511 |
| Native Hawaiians | 7.1 /100 | #224 | Tragic $38,461 |
| French | 7.0 /100 | #225 | Tragic $38,457 |
| French Canadians | 6.8 /100 | #226 | Tragic $38,436 |
Demographics Similar to Osage by Median Female Earnings
In terms of median female earnings, the demographic groups most similar to Osage are Immigrants from Nicaragua ($36,023, a difference of 0.030%), Immigrants from Zaire ($36,017, a difference of 0.050%), Paiute ($36,056, a difference of 0.060%), Bangladeshi ($35,960, a difference of 0.21%), and Indonesian ($36,140, a difference of 0.29%).
| Demographics | Rating | Rank | Median Female Earnings |
| Immigrants | Caribbean | 0.1 /100 | #279 | Tragic $36,414 |
| Iroquois | 0.1 /100 | #280 | Tragic $36,408 |
| Spanish Americans | 0.1 /100 | #281 | Tragic $36,391 |
| Haitians | 0.1 /100 | #282 | Tragic $36,374 |
| Immigrants | Haiti | 0.1 /100 | #283 | Tragic $36,203 |
| Indonesians | 0.1 /100 | #284 | Tragic $36,140 |
| Paiute | 0.1 /100 | #285 | Tragic $36,056 |
| Osage | 0.0 /100 | #286 | Tragic $36,034 |
| Immigrants | Nicaragua | 0.0 /100 | #287 | Tragic $36,023 |
| Immigrants | Zaire | 0.0 /100 | #288 | Tragic $36,017 |
| Bangladeshis | 0.0 /100 | #289 | Tragic $35,960 |
| Central American Indians | 0.0 /100 | #290 | Tragic $35,930 |
| Blackfeet | 0.0 /100 | #291 | Tragic $35,864 |
| Americans | 0.0 /100 | #292 | Tragic $35,777 |
| Guatemalans | 0.0 /100 | #293 | Tragic $35,695 |