Tlingit-Haida vs Immigrants from Netherlands Median Female Earnings
COMPARE
Tlingit-Haida
Immigrants from Netherlands
Median Female Earnings
Median Female Earnings Comparison
Tlingit-Haida
Immigrants from Netherlands
$39,513
MEDIAN FEMALE EARNINGS
40.5/ 100
METRIC RATING
182nd/ 347
METRIC RANK
$41,870
MEDIAN FEMALE EARNINGS
98.9/ 100
METRIC RATING
95th/ 347
METRIC RANK
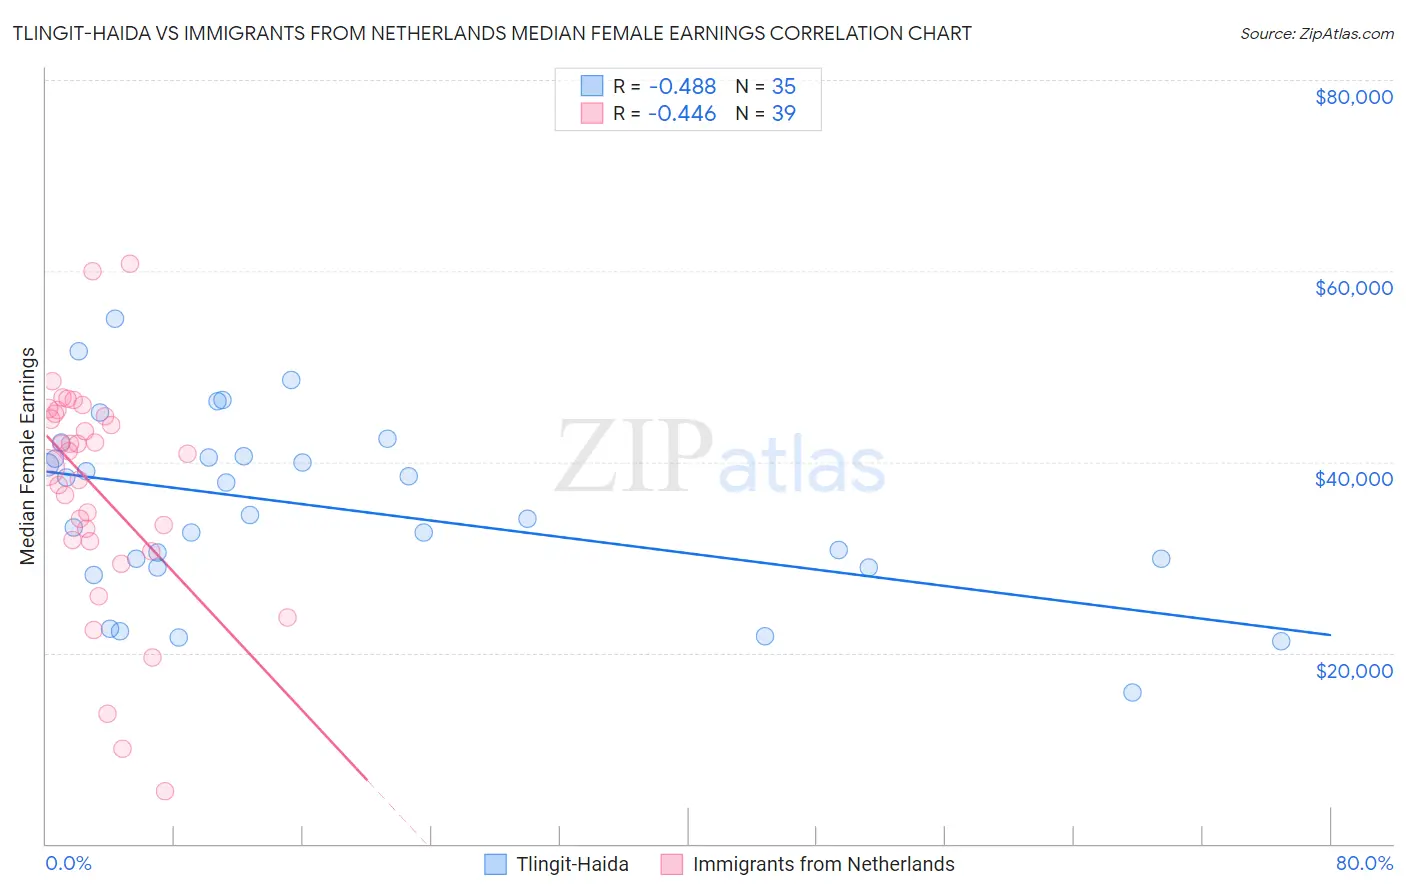
Tlingit-Haida vs Immigrants from Netherlands Median Female Earnings Correlation Chart
The statistical analysis conducted on geographies consisting of 60,850,593 people shows a moderate negative correlation between the proportion of Tlingit-Haida and median female earnings in the United States with a correlation coefficient (R) of -0.488 and weighted average of $39,513. Similarly, the statistical analysis conducted on geographies consisting of 237,807,250 people shows a moderate negative correlation between the proportion of Immigrants from Netherlands and median female earnings in the United States with a correlation coefficient (R) of -0.446 and weighted average of $41,870, a difference of 6.0%.
Median Female Earnings Correlation Summary
| Measurement | Tlingit-Haida | Immigrants from Netherlands |
| Minimum | $15,833 | $5,512 |
| Maximum | $55,000 | $60,703 |
| Range | $39,167 | $55,191 |
| Mean | $35,190 | $37,129 |
| Median | $34,397 | $40,875 |
| Interquartile 25% (IQ1) | $28,977 | $31,744 |
| Interquartile 75% (IQ3) | $40,590 | $45,060 |
| Interquartile Range (IQR) | $11,613 | $13,315 |
| Standard Deviation (Sample) | $9,336 | $11,943 |
| Standard Deviation (Population) | $9,202 | $11,789 |
Similar Demographics by Median Female Earnings
Demographics Similar to Tlingit-Haida by Median Female Earnings
In terms of median female earnings, the demographic groups most similar to Tlingit-Haida are Hungarian ($39,510, a difference of 0.010%), Tsimshian ($39,530, a difference of 0.050%), Immigrants from Kenya ($39,535, a difference of 0.060%), European ($39,457, a difference of 0.14%), and Immigrants from West Indies ($39,441, a difference of 0.18%).
| Demographics | Rating | Rank | Median Female Earnings |
| Immigrants | South America | 47.2 /100 | #175 | Average $39,643 |
| Nigerians | 47.0 /100 | #176 | Average $39,641 |
| Costa Ricans | 46.1 /100 | #177 | Average $39,622 |
| Slavs | 45.6 /100 | #178 | Average $39,613 |
| Immigrants | Germany | 45.1 /100 | #179 | Average $39,603 |
| Immigrants | Kenya | 41.6 /100 | #180 | Average $39,535 |
| Tsimshian | 41.4 /100 | #181 | Average $39,530 |
| Tlingit-Haida | 40.5 /100 | #182 | Average $39,513 |
| Hungarians | 40.3 /100 | #183 | Average $39,510 |
| Europeans | 37.7 /100 | #184 | Fair $39,457 |
| Immigrants | West Indies | 36.9 /100 | #185 | Fair $39,441 |
| Colombians | 36.9 /100 | #186 | Fair $39,439 |
| Swedes | 36.0 /100 | #187 | Fair $39,421 |
| Bermudans | 35.9 /100 | #188 | Fair $39,418 |
| Senegalese | 34.2 /100 | #189 | Fair $39,384 |
Demographics Similar to Immigrants from Netherlands by Median Female Earnings
In terms of median female earnings, the demographic groups most similar to Immigrants from Netherlands are Moroccan ($41,872, a difference of 0.0%), South African ($41,825, a difference of 0.11%), Immigrants from Hungary ($41,820, a difference of 0.12%), Immigrants from Grenada ($41,932, a difference of 0.15%), and Argentinean ($41,952, a difference of 0.20%).
| Demographics | Rating | Rank | Median Female Earnings |
| Immigrants | Northern Africa | 99.3 /100 | #88 | Exceptional $42,084 |
| Immigrants | Afghanistan | 99.3 /100 | #89 | Exceptional $42,055 |
| Ukrainians | 99.2 /100 | #90 | Exceptional $42,015 |
| Immigrants | Western Europe | 99.2 /100 | #91 | Exceptional $41,990 |
| Argentineans | 99.1 /100 | #92 | Exceptional $41,952 |
| Immigrants | Grenada | 99.0 /100 | #93 | Exceptional $41,932 |
| Moroccans | 98.9 /100 | #94 | Exceptional $41,872 |
| Immigrants | Netherlands | 98.9 /100 | #95 | Exceptional $41,870 |
| South Africans | 98.8 /100 | #96 | Exceptional $41,825 |
| Immigrants | Hungary | 98.8 /100 | #97 | Exceptional $41,820 |
| Immigrants | Scotland | 98.7 /100 | #98 | Exceptional $41,771 |
| Immigrants | Barbados | 98.4 /100 | #99 | Exceptional $41,685 |
| Romanians | 98.3 /100 | #100 | Exceptional $41,663 |
| Immigrants | Fiji | 98.3 /100 | #101 | Exceptional $41,656 |
| Immigrants | Poland | 98.2 /100 | #102 | Exceptional $41,630 |