Nepalese vs Immigrants from Colombia Median Female Earnings
COMPARE
Nepalese
Immigrants from Colombia
Median Female Earnings
Median Female Earnings Comparison
Nepalese
Immigrants from Colombia
$38,603
MEDIAN FEMALE EARNINGS
9.3/ 100
METRIC RATING
219th/ 347
METRIC RANK
$38,913
MEDIAN FEMALE EARNINGS
16.3/ 100
METRIC RATING
205th/ 347
METRIC RANK
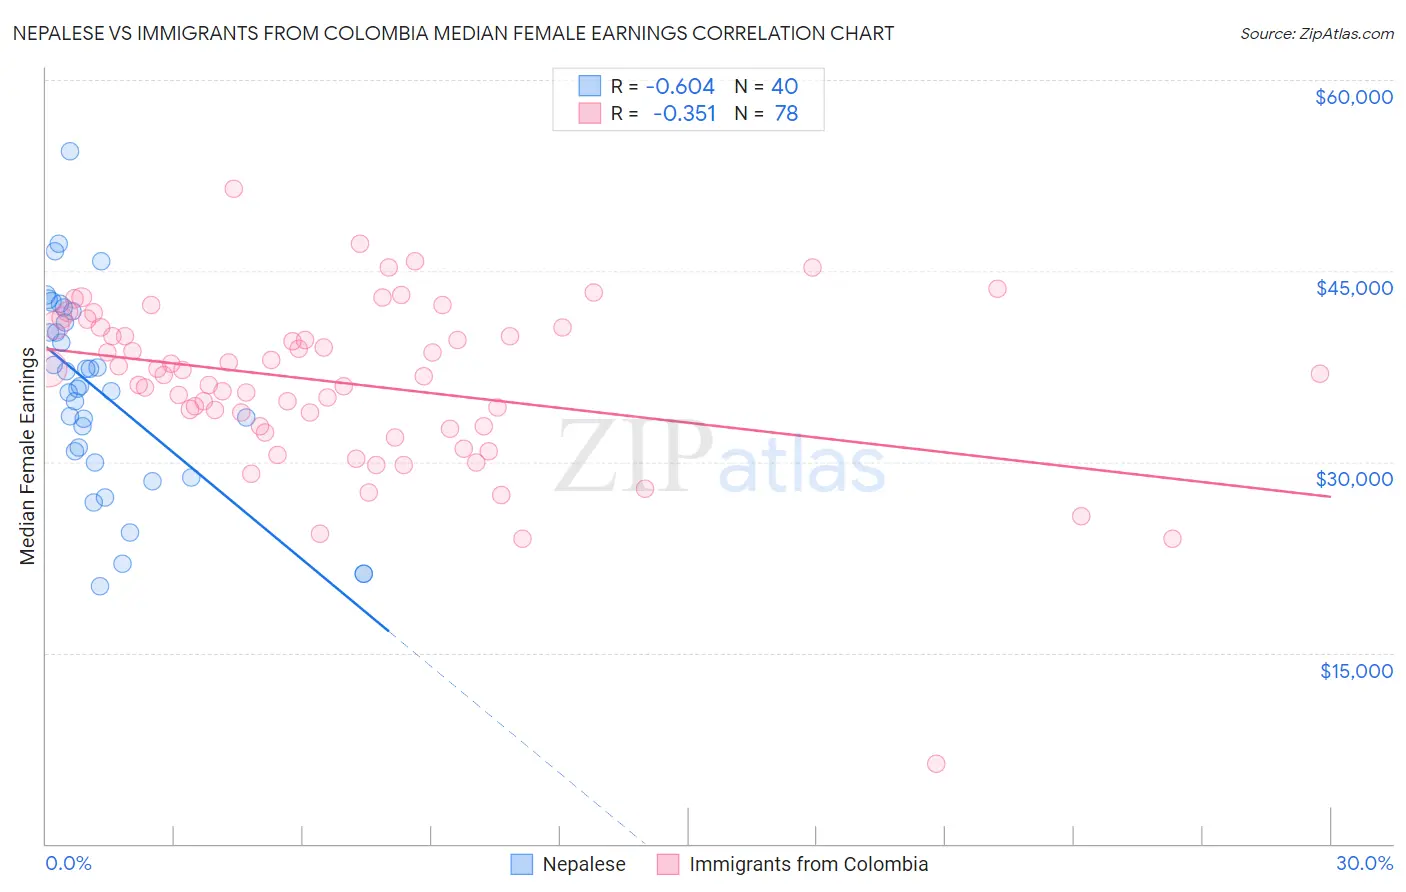
Nepalese vs Immigrants from Colombia Median Female Earnings Correlation Chart
The statistical analysis conducted on geographies consisting of 24,521,755 people shows a significant negative correlation between the proportion of Nepalese and median female earnings in the United States with a correlation coefficient (R) of -0.604 and weighted average of $38,603. Similarly, the statistical analysis conducted on geographies consisting of 378,569,678 people shows a mild negative correlation between the proportion of Immigrants from Colombia and median female earnings in the United States with a correlation coefficient (R) of -0.351 and weighted average of $38,913, a difference of 0.80%.
Median Female Earnings Correlation Summary
| Measurement | Nepalese | Immigrants from Colombia |
| Minimum | $20,210 | $6,250 |
| Maximum | $54,407 | $51,464 |
| Range | $34,197 | $45,214 |
| Mean | $35,483 | $36,175 |
| Median | $35,860 | $36,876 |
| Interquartile 25% (IQ1) | $30,426 | $32,775 |
| Interquartile 75% (IQ3) | $41,423 | $40,514 |
| Interquartile Range (IQR) | $10,997 | $7,739 |
| Standard Deviation (Sample) | $7,837 | $6,580 |
| Standard Deviation (Population) | $7,738 | $6,538 |
Demographics Similar to Nepalese and Immigrants from Colombia by Median Female Earnings
In terms of median female earnings, the demographic groups most similar to Nepalese are Cape Verdean ($38,614, a difference of 0.030%), Immigrants from Jamaica ($38,625, a difference of 0.060%), Yugoslavian ($38,573, a difference of 0.080%), Immigrants from the Azores ($38,573, a difference of 0.080%), and Immigrants from Ecuador ($38,644, a difference of 0.11%). Similarly, the demographic groups most similar to Immigrants from Colombia are Immigrants from Bosnia and Herzegovina ($38,886, a difference of 0.070%), Immigrants from Uruguay ($38,945, a difference of 0.080%), Czech ($38,992, a difference of 0.20%), Immigrants from Cambodia ($38,833, a difference of 0.20%), and Immigrants from Thailand ($38,810, a difference of 0.26%).
| Demographics | Rating | Rank | Median Female Earnings |
| Slovaks | 19.9 /100 | #202 | Poor $39,029 |
| Czechs | 18.7 /100 | #203 | Poor $38,992 |
| Immigrants | Uruguay | 17.3 /100 | #204 | Poor $38,945 |
| Immigrants | Colombia | 16.3 /100 | #205 | Poor $38,913 |
| Immigrants | Bosnia and Herzegovina | 15.6 /100 | #206 | Poor $38,886 |
| Immigrants | Cambodia | 14.2 /100 | #207 | Poor $38,833 |
| Immigrants | Thailand | 13.6 /100 | #208 | Poor $38,810 |
| Norwegians | 13.4 /100 | #209 | Poor $38,802 |
| Czechoslovakians | 12.0 /100 | #210 | Poor $38,738 |
| Aleuts | 11.6 /100 | #211 | Poor $38,719 |
| Guamanians/Chamorros | 11.5 /100 | #212 | Poor $38,717 |
| Jamaicans | 10.5 /100 | #213 | Poor $38,670 |
| Iraqis | 10.5 /100 | #214 | Poor $38,666 |
| Spaniards | 10.3 /100 | #215 | Poor $38,656 |
| Immigrants | Ecuador | 10.1 /100 | #216 | Poor $38,644 |
| Immigrants | Jamaica | 9.7 /100 | #217 | Tragic $38,625 |
| Cape Verdeans | 9.5 /100 | #218 | Tragic $38,614 |
| Nepalese | 9.3 /100 | #219 | Tragic $38,603 |
| Yugoslavians | 8.8 /100 | #220 | Tragic $38,573 |
| Immigrants | Azores | 8.8 /100 | #221 | Tragic $38,573 |
| Japanese | 8.1 /100 | #222 | Tragic $38,528 |