Nepalese vs Immigrants from Ghana Median Female Earnings
COMPARE
Nepalese
Immigrants from Ghana
Median Female Earnings
Median Female Earnings Comparison
Nepalese
Immigrants from Ghana
$38,603
MEDIAN FEMALE EARNINGS
9.3/ 100
METRIC RATING
219th/ 347
METRIC RANK
$39,894
MEDIAN FEMALE EARNINGS
60.0/ 100
METRIC RATING
166th/ 347
METRIC RANK
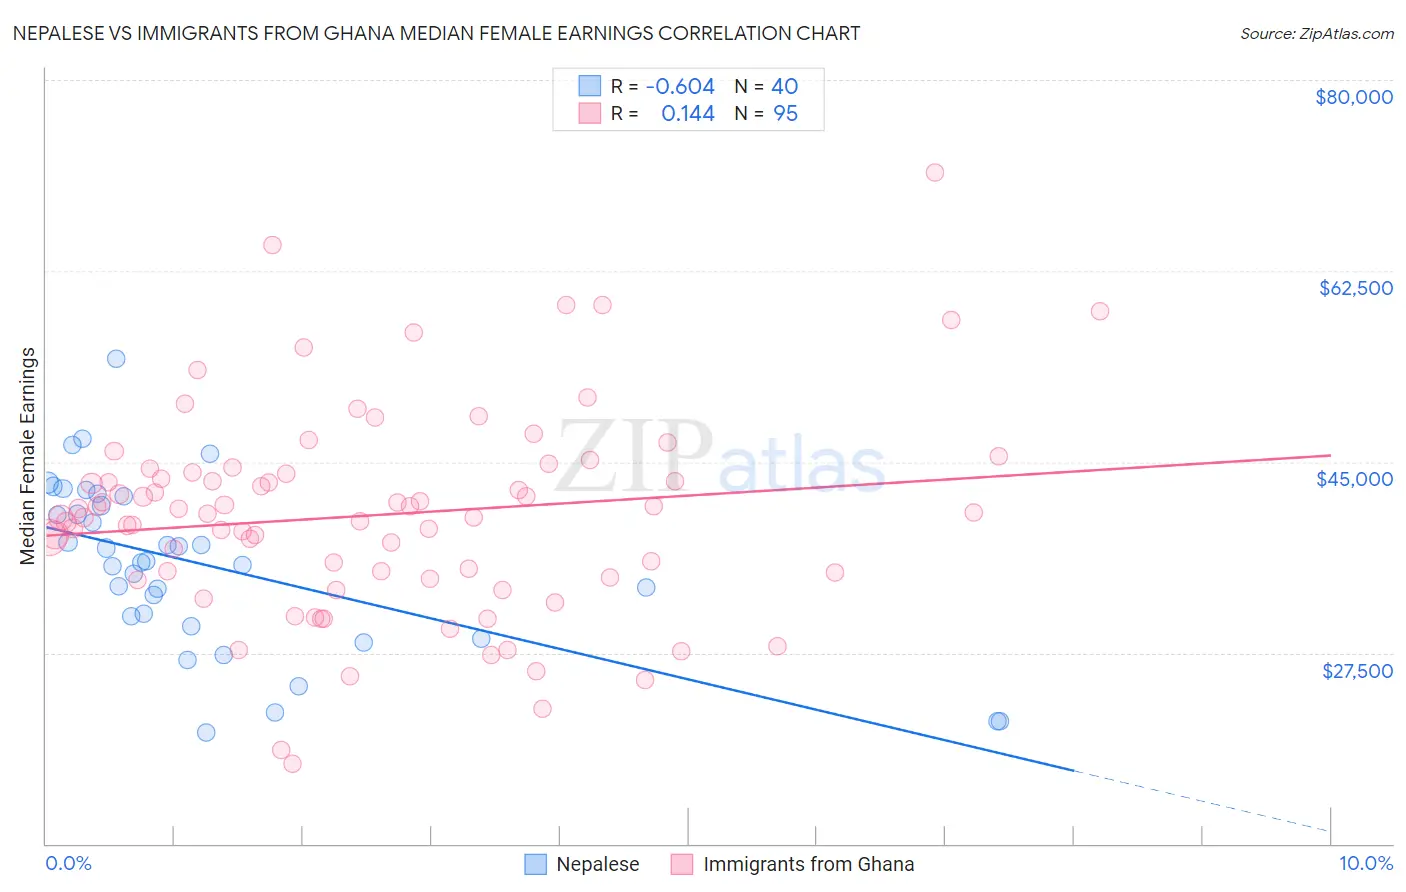
Nepalese vs Immigrants from Ghana Median Female Earnings Correlation Chart
The statistical analysis conducted on geographies consisting of 24,521,755 people shows a significant negative correlation between the proportion of Nepalese and median female earnings in the United States with a correlation coefficient (R) of -0.604 and weighted average of $38,603. Similarly, the statistical analysis conducted on geographies consisting of 199,948,896 people shows a poor positive correlation between the proportion of Immigrants from Ghana and median female earnings in the United States with a correlation coefficient (R) of 0.144 and weighted average of $39,894, a difference of 3.3%.
Median Female Earnings Correlation Summary
| Measurement | Nepalese | Immigrants from Ghana |
| Minimum | $20,210 | $17,379 |
| Maximum | $54,407 | $71,536 |
| Range | $34,197 | $54,157 |
| Mean | $35,483 | $40,108 |
| Median | $35,860 | $40,246 |
| Interquartile 25% (IQ1) | $30,426 | $34,346 |
| Interquartile 75% (IQ3) | $41,423 | $44,036 |
| Interquartile Range (IQR) | $10,997 | $9,690 |
| Standard Deviation (Sample) | $7,837 | $9,436 |
| Standard Deviation (Population) | $7,738 | $9,386 |
Similar Demographics by Median Female Earnings
Demographics Similar to Nepalese by Median Female Earnings
In terms of median female earnings, the demographic groups most similar to Nepalese are Cape Verdean ($38,614, a difference of 0.030%), Immigrants from Jamaica ($38,625, a difference of 0.060%), Yugoslavian ($38,573, a difference of 0.080%), Immigrants from the Azores ($38,573, a difference of 0.080%), and Immigrants from Ecuador ($38,644, a difference of 0.11%).
| Demographics | Rating | Rank | Median Female Earnings |
| Guamanians/Chamorros | 11.5 /100 | #212 | Poor $38,717 |
| Jamaicans | 10.5 /100 | #213 | Poor $38,670 |
| Iraqis | 10.5 /100 | #214 | Poor $38,666 |
| Spaniards | 10.3 /100 | #215 | Poor $38,656 |
| Immigrants | Ecuador | 10.1 /100 | #216 | Poor $38,644 |
| Immigrants | Jamaica | 9.7 /100 | #217 | Tragic $38,625 |
| Cape Verdeans | 9.5 /100 | #218 | Tragic $38,614 |
| Nepalese | 9.3 /100 | #219 | Tragic $38,603 |
| Yugoslavians | 8.8 /100 | #220 | Tragic $38,573 |
| Immigrants | Azores | 8.8 /100 | #221 | Tragic $38,573 |
| Japanese | 8.1 /100 | #222 | Tragic $38,528 |
| Immigrants | Sudan | 7.8 /100 | #223 | Tragic $38,511 |
| Native Hawaiians | 7.1 /100 | #224 | Tragic $38,461 |
| French | 7.0 /100 | #225 | Tragic $38,457 |
| French Canadians | 6.8 /100 | #226 | Tragic $38,436 |
Demographics Similar to Immigrants from Ghana by Median Female Earnings
In terms of median female earnings, the demographic groups most similar to Immigrants from Ghana are Luxembourger ($39,891, a difference of 0.010%), Immigrants from Bangladesh ($39,910, a difference of 0.040%), Immigrants from Peru ($39,871, a difference of 0.060%), Kenyan ($39,860, a difference of 0.080%), and Immigrants from Saudi Arabia ($39,952, a difference of 0.15%).
| Demographics | Rating | Rank | Median Female Earnings |
| Immigrants | Vietnam | 72.0 /100 | #159 | Good $40,153 |
| Inupiat | 68.9 /100 | #160 | Good $40,080 |
| Alsatians | 68.0 /100 | #161 | Good $40,060 |
| South American Indians | 66.1 /100 | #162 | Good $40,019 |
| Lebanese | 65.5 /100 | #163 | Good $40,006 |
| Immigrants | Saudi Arabia | 62.9 /100 | #164 | Good $39,952 |
| Immigrants | Bangladesh | 60.8 /100 | #165 | Good $39,910 |
| Immigrants | Ghana | 60.0 /100 | #166 | Good $39,894 |
| Luxembourgers | 59.9 /100 | #167 | Average $39,891 |
| Immigrants | Peru | 58.9 /100 | #168 | Average $39,871 |
| Kenyans | 58.4 /100 | #169 | Average $39,860 |
| Slovenes | 56.2 /100 | #170 | Average $39,817 |
| Immigrants | Portugal | 54.7 /100 | #171 | Average $39,788 |
| British | 53.8 /100 | #172 | Average $39,772 |
| Canadians | 51.4 /100 | #173 | Average $39,724 |