Nepalese vs Ethiopian Median Female Earnings
COMPARE
Nepalese
Ethiopian
Median Female Earnings
Median Female Earnings Comparison
Nepalese
Ethiopians
$38,603
MEDIAN FEMALE EARNINGS
9.3/ 100
METRIC RATING
219th/ 347
METRIC RANK
$43,243
MEDIAN FEMALE EARNINGS
99.9/ 100
METRIC RATING
57th/ 347
METRIC RANK
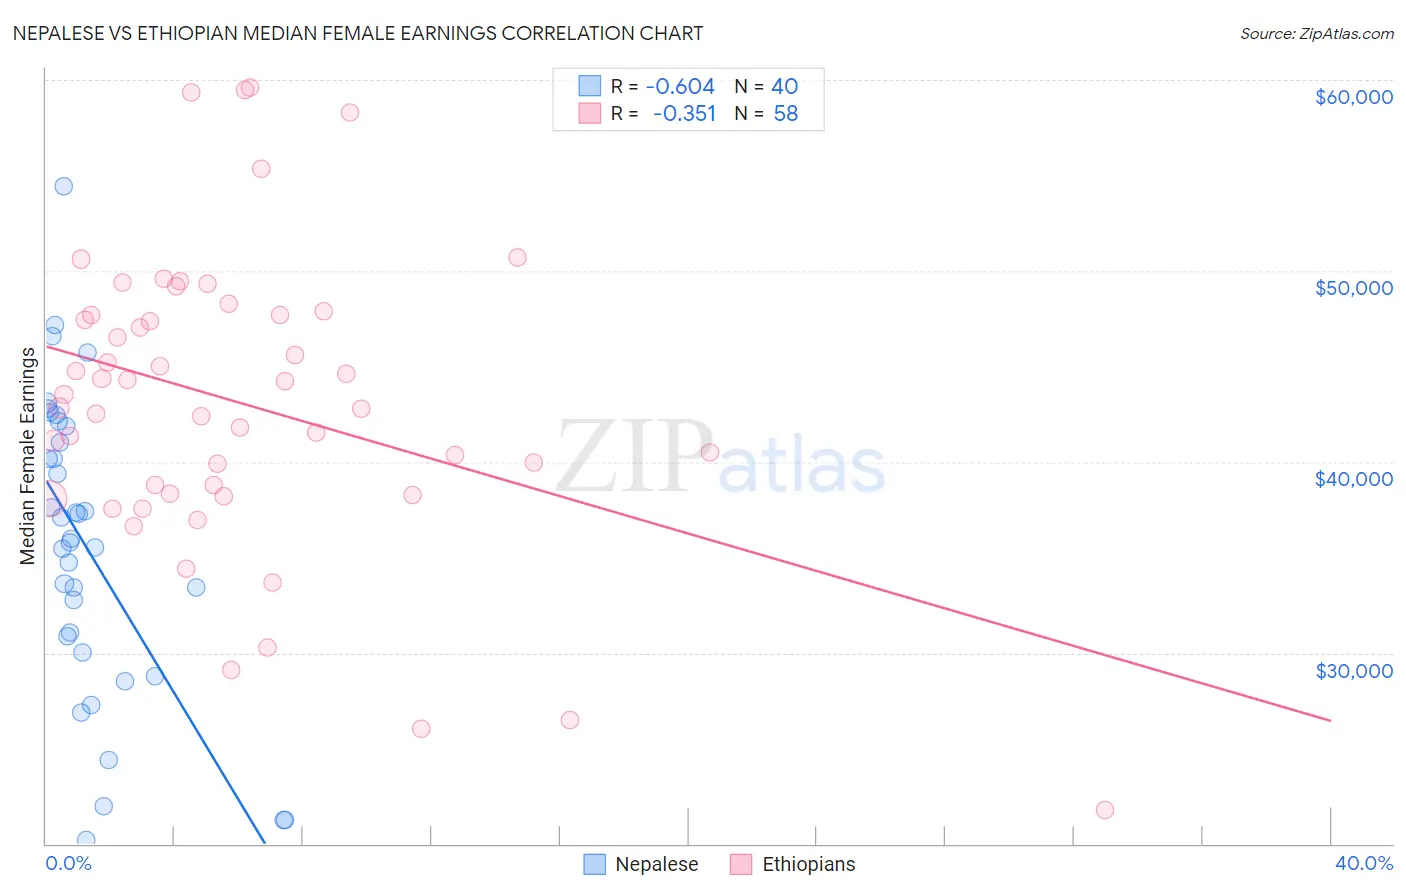
Nepalese vs Ethiopian Median Female Earnings Correlation Chart
The statistical analysis conducted on geographies consisting of 24,521,755 people shows a significant negative correlation between the proportion of Nepalese and median female earnings in the United States with a correlation coefficient (R) of -0.604 and weighted average of $38,603. Similarly, the statistical analysis conducted on geographies consisting of 223,241,748 people shows a mild negative correlation between the proportion of Ethiopians and median female earnings in the United States with a correlation coefficient (R) of -0.351 and weighted average of $43,243, a difference of 12.0%.
Median Female Earnings Correlation Summary
| Measurement | Nepalese | Ethiopian |
| Minimum | $20,210 | $21,797 |
| Maximum | $54,407 | $59,585 |
| Range | $34,197 | $37,788 |
| Mean | $35,483 | $43,098 |
| Median | $35,860 | $43,184 |
| Interquartile 25% (IQ1) | $30,426 | $38,309 |
| Interquartile 75% (IQ3) | $41,423 | $47,681 |
| Interquartile Range (IQR) | $10,997 | $9,372 |
| Standard Deviation (Sample) | $7,837 | $7,882 |
| Standard Deviation (Population) | $7,738 | $7,814 |
Similar Demographics by Median Female Earnings
Demographics Similar to Nepalese by Median Female Earnings
In terms of median female earnings, the demographic groups most similar to Nepalese are Cape Verdean ($38,614, a difference of 0.030%), Immigrants from Jamaica ($38,625, a difference of 0.060%), Yugoslavian ($38,573, a difference of 0.080%), Immigrants from the Azores ($38,573, a difference of 0.080%), and Immigrants from Ecuador ($38,644, a difference of 0.11%).
| Demographics | Rating | Rank | Median Female Earnings |
| Guamanians/Chamorros | 11.5 /100 | #212 | Poor $38,717 |
| Jamaicans | 10.5 /100 | #213 | Poor $38,670 |
| Iraqis | 10.5 /100 | #214 | Poor $38,666 |
| Spaniards | 10.3 /100 | #215 | Poor $38,656 |
| Immigrants | Ecuador | 10.1 /100 | #216 | Poor $38,644 |
| Immigrants | Jamaica | 9.7 /100 | #217 | Tragic $38,625 |
| Cape Verdeans | 9.5 /100 | #218 | Tragic $38,614 |
| Nepalese | 9.3 /100 | #219 | Tragic $38,603 |
| Yugoslavians | 8.8 /100 | #220 | Tragic $38,573 |
| Immigrants | Azores | 8.8 /100 | #221 | Tragic $38,573 |
| Japanese | 8.1 /100 | #222 | Tragic $38,528 |
| Immigrants | Sudan | 7.8 /100 | #223 | Tragic $38,511 |
| Native Hawaiians | 7.1 /100 | #224 | Tragic $38,461 |
| French | 7.0 /100 | #225 | Tragic $38,457 |
| French Canadians | 6.8 /100 | #226 | Tragic $38,436 |
Demographics Similar to Ethiopians by Median Female Earnings
In terms of median female earnings, the demographic groups most similar to Ethiopians are Immigrants from Croatia ($43,258, a difference of 0.040%), Egyptian ($43,305, a difference of 0.14%), Immigrants from Eastern Europe ($43,309, a difference of 0.15%), Australian ($43,308, a difference of 0.15%), and Paraguayan ($43,173, a difference of 0.16%).
| Demographics | Rating | Rank | Median Female Earnings |
| Immigrants | Uzbekistan | 100.0 /100 | #50 | Exceptional $43,363 |
| Maltese | 100.0 /100 | #51 | Exceptional $43,357 |
| Immigrants | Lithuania | 99.9 /100 | #52 | Exceptional $43,317 |
| Immigrants | Eastern Europe | 99.9 /100 | #53 | Exceptional $43,309 |
| Australians | 99.9 /100 | #54 | Exceptional $43,308 |
| Egyptians | 99.9 /100 | #55 | Exceptional $43,305 |
| Immigrants | Croatia | 99.9 /100 | #56 | Exceptional $43,258 |
| Ethiopians | 99.9 /100 | #57 | Exceptional $43,243 |
| Paraguayans | 99.9 /100 | #58 | Exceptional $43,173 |
| Estonians | 99.9 /100 | #59 | Exceptional $43,106 |
| Immigrants | Latvia | 99.9 /100 | #60 | Exceptional $43,099 |
| Immigrants | Bulgaria | 99.9 /100 | #61 | Exceptional $43,085 |
| Afghans | 99.9 /100 | #62 | Exceptional $43,077 |
| Immigrants | Ukraine | 99.9 /100 | #63 | Exceptional $43,069 |
| Immigrants | Pakistan | 99.9 /100 | #64 | Exceptional $43,052 |