Immigrants from Ukraine vs Immigrants from Netherlands Median Female Earnings
COMPARE
Immigrants from Ukraine
Immigrants from Netherlands
Median Female Earnings
Median Female Earnings Comparison
Immigrants from Ukraine
Immigrants from Netherlands
$43,069
MEDIAN FEMALE EARNINGS
99.9/ 100
METRIC RATING
63rd/ 347
METRIC RANK
$41,870
MEDIAN FEMALE EARNINGS
98.9/ 100
METRIC RATING
95th/ 347
METRIC RANK
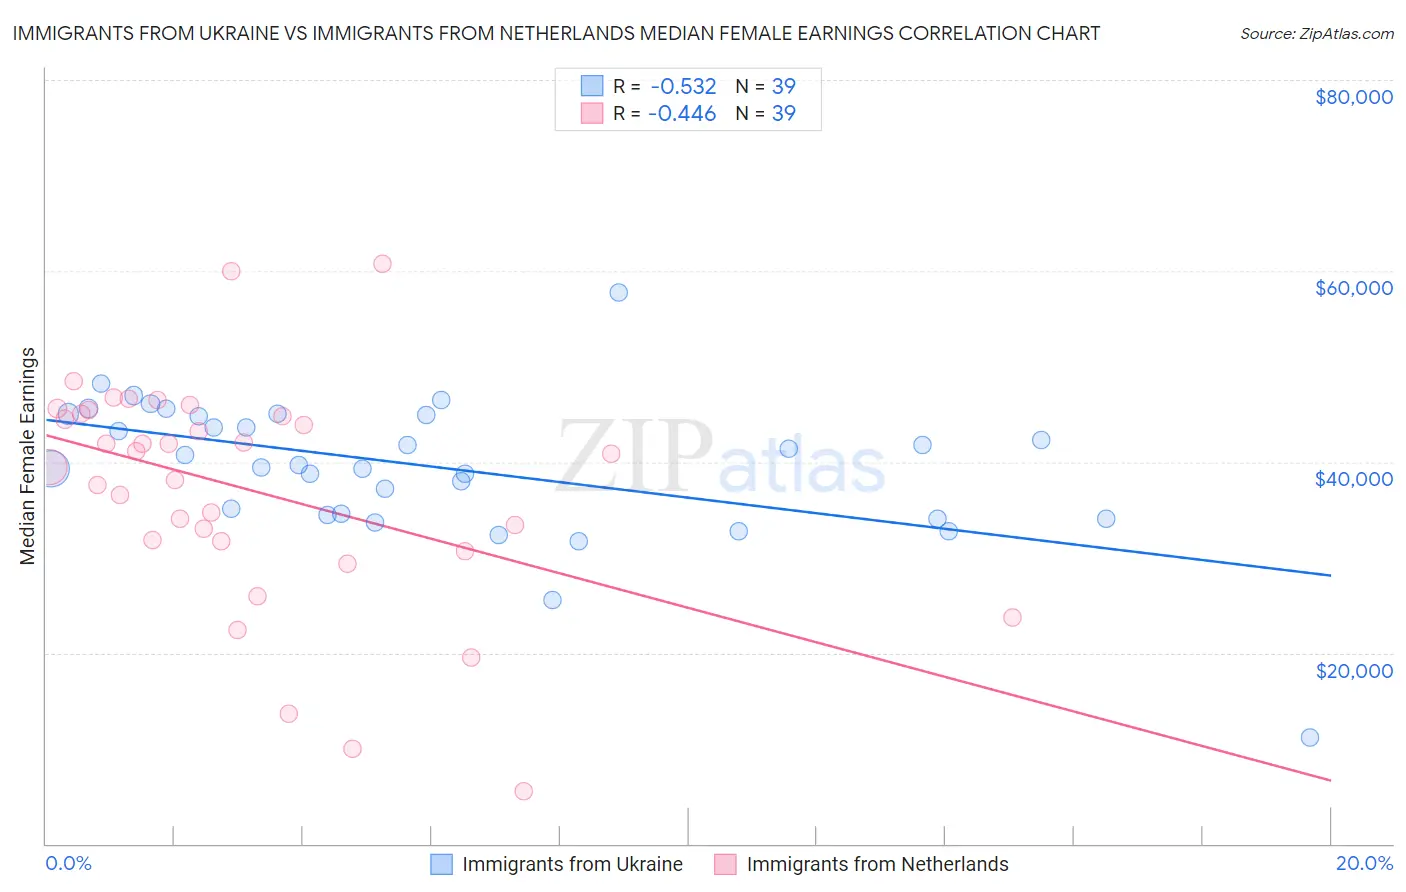
Immigrants from Ukraine vs Immigrants from Netherlands Median Female Earnings Correlation Chart
The statistical analysis conducted on geographies consisting of 289,632,492 people shows a substantial negative correlation between the proportion of Immigrants from Ukraine and median female earnings in the United States with a correlation coefficient (R) of -0.532 and weighted average of $43,069. Similarly, the statistical analysis conducted on geographies consisting of 237,807,250 people shows a moderate negative correlation between the proportion of Immigrants from Netherlands and median female earnings in the United States with a correlation coefficient (R) of -0.446 and weighted average of $41,870, a difference of 2.9%.
Median Female Earnings Correlation Summary
| Measurement | Immigrants from Ukraine | Immigrants from Netherlands |
| Minimum | $11,071 | $5,512 |
| Maximum | $57,684 | $60,703 |
| Range | $46,613 | $55,191 |
| Mean | $39,415 | $37,129 |
| Median | $39,738 | $40,875 |
| Interquartile 25% (IQ1) | $34,500 | $31,744 |
| Interquartile 75% (IQ3) | $44,923 | $45,060 |
| Interquartile Range (IQR) | $10,424 | $13,315 |
| Standard Deviation (Sample) | $7,597 | $11,943 |
| Standard Deviation (Population) | $7,499 | $11,789 |
Similar Demographics by Median Female Earnings
Demographics Similar to Immigrants from Ukraine by Median Female Earnings
In terms of median female earnings, the demographic groups most similar to Immigrants from Ukraine are Afghan ($43,077, a difference of 0.020%), Immigrants from Bulgaria ($43,085, a difference of 0.040%), Immigrants from Pakistan ($43,052, a difference of 0.040%), Immigrants from Latvia ($43,099, a difference of 0.070%), and Estonian ($43,106, a difference of 0.090%).
| Demographics | Rating | Rank | Median Female Earnings |
| Immigrants | Croatia | 99.9 /100 | #56 | Exceptional $43,258 |
| Ethiopians | 99.9 /100 | #57 | Exceptional $43,243 |
| Paraguayans | 99.9 /100 | #58 | Exceptional $43,173 |
| Estonians | 99.9 /100 | #59 | Exceptional $43,106 |
| Immigrants | Latvia | 99.9 /100 | #60 | Exceptional $43,099 |
| Immigrants | Bulgaria | 99.9 /100 | #61 | Exceptional $43,085 |
| Afghans | 99.9 /100 | #62 | Exceptional $43,077 |
| Immigrants | Ukraine | 99.9 /100 | #63 | Exceptional $43,069 |
| Immigrants | Pakistan | 99.9 /100 | #64 | Exceptional $43,052 |
| Sierra Leoneans | 99.9 /100 | #65 | Exceptional $42,868 |
| Immigrants | Norway | 99.9 /100 | #66 | Exceptional $42,837 |
| Immigrants | Egypt | 99.9 /100 | #67 | Exceptional $42,837 |
| Immigrants | Austria | 99.8 /100 | #68 | Exceptional $42,824 |
| Immigrants | Spain | 99.8 /100 | #69 | Exceptional $42,815 |
| Immigrants | Ethiopia | 99.8 /100 | #70 | Exceptional $42,744 |
Demographics Similar to Immigrants from Netherlands by Median Female Earnings
In terms of median female earnings, the demographic groups most similar to Immigrants from Netherlands are Moroccan ($41,872, a difference of 0.0%), South African ($41,825, a difference of 0.11%), Immigrants from Hungary ($41,820, a difference of 0.12%), Immigrants from Grenada ($41,932, a difference of 0.15%), and Argentinean ($41,952, a difference of 0.20%).
| Demographics | Rating | Rank | Median Female Earnings |
| Immigrants | Northern Africa | 99.3 /100 | #88 | Exceptional $42,084 |
| Immigrants | Afghanistan | 99.3 /100 | #89 | Exceptional $42,055 |
| Ukrainians | 99.2 /100 | #90 | Exceptional $42,015 |
| Immigrants | Western Europe | 99.2 /100 | #91 | Exceptional $41,990 |
| Argentineans | 99.1 /100 | #92 | Exceptional $41,952 |
| Immigrants | Grenada | 99.0 /100 | #93 | Exceptional $41,932 |
| Moroccans | 98.9 /100 | #94 | Exceptional $41,872 |
| Immigrants | Netherlands | 98.9 /100 | #95 | Exceptional $41,870 |
| South Africans | 98.8 /100 | #96 | Exceptional $41,825 |
| Immigrants | Hungary | 98.8 /100 | #97 | Exceptional $41,820 |
| Immigrants | Scotland | 98.7 /100 | #98 | Exceptional $41,771 |
| Immigrants | Barbados | 98.4 /100 | #99 | Exceptional $41,685 |
| Romanians | 98.3 /100 | #100 | Exceptional $41,663 |
| Immigrants | Fiji | 98.3 /100 | #101 | Exceptional $41,656 |
| Immigrants | Poland | 98.2 /100 | #102 | Exceptional $41,630 |