Nepalese vs Immigrants from Kuwait Median Female Earnings
COMPARE
Nepalese
Immigrants from Kuwait
Median Female Earnings
Median Female Earnings Comparison
Nepalese
Immigrants from Kuwait
$38,603
MEDIAN FEMALE EARNINGS
9.3/ 100
METRIC RATING
219th/ 347
METRIC RANK
$41,055
MEDIAN FEMALE EARNINGS
94.4/ 100
METRIC RATING
120th/ 347
METRIC RANK
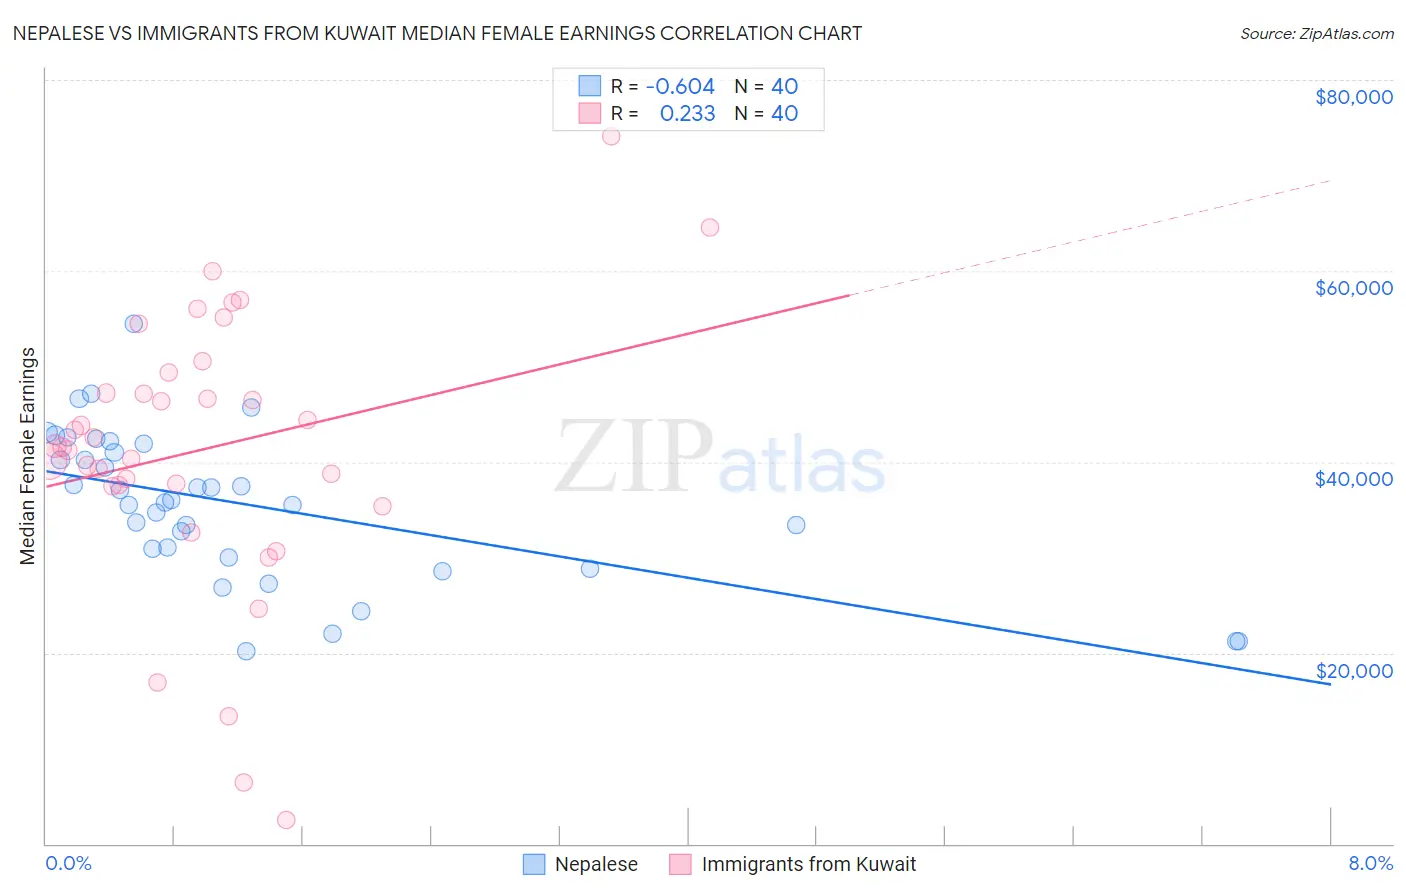
Nepalese vs Immigrants from Kuwait Median Female Earnings Correlation Chart
The statistical analysis conducted on geographies consisting of 24,521,755 people shows a significant negative correlation between the proportion of Nepalese and median female earnings in the United States with a correlation coefficient (R) of -0.604 and weighted average of $38,603. Similarly, the statistical analysis conducted on geographies consisting of 136,915,503 people shows a weak positive correlation between the proportion of Immigrants from Kuwait and median female earnings in the United States with a correlation coefficient (R) of 0.233 and weighted average of $41,055, a difference of 6.4%.
Median Female Earnings Correlation Summary
| Measurement | Nepalese | Immigrants from Kuwait |
| Minimum | $20,210 | $2,499 |
| Maximum | $54,407 | $74,079 |
| Range | $34,197 | $71,580 |
| Mean | $35,483 | $41,287 |
| Median | $35,860 | $41,597 |
| Interquartile 25% (IQ1) | $30,426 | $37,555 |
| Interquartile 75% (IQ3) | $41,423 | $48,255 |
| Interquartile Range (IQR) | $10,997 | $10,700 |
| Standard Deviation (Sample) | $7,837 | $14,451 |
| Standard Deviation (Population) | $7,738 | $14,269 |
Similar Demographics by Median Female Earnings
Demographics Similar to Nepalese by Median Female Earnings
In terms of median female earnings, the demographic groups most similar to Nepalese are Cape Verdean ($38,614, a difference of 0.030%), Immigrants from Jamaica ($38,625, a difference of 0.060%), Yugoslavian ($38,573, a difference of 0.080%), Immigrants from the Azores ($38,573, a difference of 0.080%), and Immigrants from Ecuador ($38,644, a difference of 0.11%).
| Demographics | Rating | Rank | Median Female Earnings |
| Guamanians/Chamorros | 11.5 /100 | #212 | Poor $38,717 |
| Jamaicans | 10.5 /100 | #213 | Poor $38,670 |
| Iraqis | 10.5 /100 | #214 | Poor $38,666 |
| Spaniards | 10.3 /100 | #215 | Poor $38,656 |
| Immigrants | Ecuador | 10.1 /100 | #216 | Poor $38,644 |
| Immigrants | Jamaica | 9.7 /100 | #217 | Tragic $38,625 |
| Cape Verdeans | 9.5 /100 | #218 | Tragic $38,614 |
| Nepalese | 9.3 /100 | #219 | Tragic $38,603 |
| Yugoslavians | 8.8 /100 | #220 | Tragic $38,573 |
| Immigrants | Azores | 8.8 /100 | #221 | Tragic $38,573 |
| Japanese | 8.1 /100 | #222 | Tragic $38,528 |
| Immigrants | Sudan | 7.8 /100 | #223 | Tragic $38,511 |
| Native Hawaiians | 7.1 /100 | #224 | Tragic $38,461 |
| French | 7.0 /100 | #225 | Tragic $38,457 |
| French Canadians | 6.8 /100 | #226 | Tragic $38,436 |
Demographics Similar to Immigrants from Kuwait by Median Female Earnings
In terms of median female earnings, the demographic groups most similar to Immigrants from Kuwait are Immigrants from Philippines ($41,114, a difference of 0.15%), Croatian ($40,993, a difference of 0.15%), Immigrants from Jordan ($40,977, a difference of 0.19%), Guyanese ($40,973, a difference of 0.20%), and Trinidadian and Tobagonian ($40,958, a difference of 0.24%).
| Demographics | Rating | Rank | Median Female Earnings |
| Macedonians | 96.4 /100 | #113 | Exceptional $41,286 |
| Immigrants | England | 96.4 /100 | #114 | Exceptional $41,277 |
| Koreans | 96.4 /100 | #115 | Exceptional $41,276 |
| Immigrants | Brazil | 96.4 /100 | #116 | Exceptional $41,273 |
| Barbadians | 96.3 /100 | #117 | Exceptional $41,261 |
| Immigrants | Lebanon | 95.6 /100 | #118 | Exceptional $41,183 |
| Immigrants | Philippines | 95.0 /100 | #119 | Exceptional $41,114 |
| Immigrants | Kuwait | 94.4 /100 | #120 | Exceptional $41,055 |
| Croatians | 93.7 /100 | #121 | Exceptional $40,993 |
| Immigrants | Jordan | 93.5 /100 | #122 | Exceptional $40,977 |
| Guyanese | 93.4 /100 | #123 | Exceptional $40,973 |
| Trinidadians and Tobagonians | 93.2 /100 | #124 | Exceptional $40,958 |
| Austrians | 92.7 /100 | #125 | Exceptional $40,923 |
| Immigrants | Trinidad and Tobago | 92.3 /100 | #126 | Exceptional $40,895 |
| Ugandans | 92.2 /100 | #127 | Exceptional $40,889 |