Nepalese vs Hmong Median Female Earnings
COMPARE
Nepalese
Hmong
Median Female Earnings
Median Female Earnings Comparison
Nepalese
Hmong
$38,603
MEDIAN FEMALE EARNINGS
9.3/ 100
METRIC RATING
219th/ 347
METRIC RANK
$35,498
MEDIAN FEMALE EARNINGS
0.0/ 100
METRIC RATING
297th/ 347
METRIC RANK
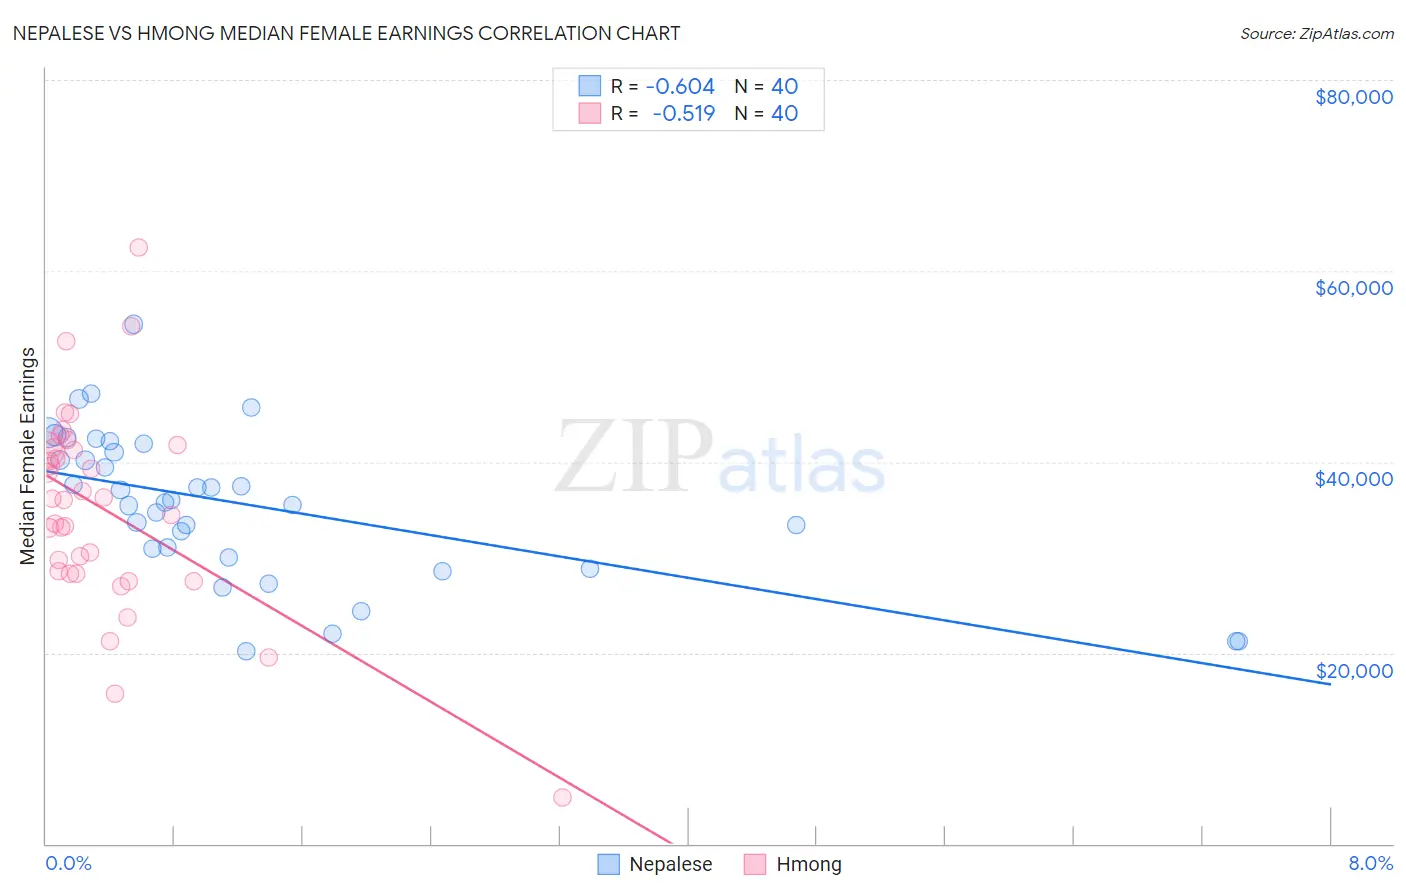
Nepalese vs Hmong Median Female Earnings Correlation Chart
The statistical analysis conducted on geographies consisting of 24,521,755 people shows a significant negative correlation between the proportion of Nepalese and median female earnings in the United States with a correlation coefficient (R) of -0.604 and weighted average of $38,603. Similarly, the statistical analysis conducted on geographies consisting of 24,681,537 people shows a substantial negative correlation between the proportion of Hmong and median female earnings in the United States with a correlation coefficient (R) of -0.519 and weighted average of $35,498, a difference of 8.7%.
Median Female Earnings Correlation Summary
| Measurement | Nepalese | Hmong |
| Minimum | $20,210 | $4,844 |
| Maximum | $54,407 | $62,438 |
| Range | $34,197 | $57,594 |
| Mean | $35,483 | $35,172 |
| Median | $35,860 | $36,091 |
| Interquartile 25% (IQ1) | $30,426 | $28,415 |
| Interquartile 75% (IQ3) | $41,423 | $41,366 |
| Interquartile Range (IQR) | $10,997 | $12,951 |
| Standard Deviation (Sample) | $7,837 | $10,537 |
| Standard Deviation (Population) | $7,738 | $10,404 |
Similar Demographics by Median Female Earnings
Demographics Similar to Nepalese by Median Female Earnings
In terms of median female earnings, the demographic groups most similar to Nepalese are Cape Verdean ($38,614, a difference of 0.030%), Immigrants from Jamaica ($38,625, a difference of 0.060%), Yugoslavian ($38,573, a difference of 0.080%), Immigrants from the Azores ($38,573, a difference of 0.080%), and Immigrants from Ecuador ($38,644, a difference of 0.11%).
| Demographics | Rating | Rank | Median Female Earnings |
| Guamanians/Chamorros | 11.5 /100 | #212 | Poor $38,717 |
| Jamaicans | 10.5 /100 | #213 | Poor $38,670 |
| Iraqis | 10.5 /100 | #214 | Poor $38,666 |
| Spaniards | 10.3 /100 | #215 | Poor $38,656 |
| Immigrants | Ecuador | 10.1 /100 | #216 | Poor $38,644 |
| Immigrants | Jamaica | 9.7 /100 | #217 | Tragic $38,625 |
| Cape Verdeans | 9.5 /100 | #218 | Tragic $38,614 |
| Nepalese | 9.3 /100 | #219 | Tragic $38,603 |
| Yugoslavians | 8.8 /100 | #220 | Tragic $38,573 |
| Immigrants | Azores | 8.8 /100 | #221 | Tragic $38,573 |
| Japanese | 8.1 /100 | #222 | Tragic $38,528 |
| Immigrants | Sudan | 7.8 /100 | #223 | Tragic $38,511 |
| Native Hawaiians | 7.1 /100 | #224 | Tragic $38,461 |
| French | 7.0 /100 | #225 | Tragic $38,457 |
| French Canadians | 6.8 /100 | #226 | Tragic $38,436 |
Demographics Similar to Hmong by Median Female Earnings
In terms of median female earnings, the demographic groups most similar to Hmong are Immigrants from Micronesia ($35,477, a difference of 0.060%), Immigrants from Guatemala ($35,444, a difference of 0.15%), Yuman ($35,377, a difference of 0.34%), Mexican American Indian ($35,629, a difference of 0.37%), and Comanche ($35,661, a difference of 0.46%).
| Demographics | Rating | Rank | Median Female Earnings |
| Central American Indians | 0.0 /100 | #290 | Tragic $35,930 |
| Blackfeet | 0.0 /100 | #291 | Tragic $35,864 |
| Americans | 0.0 /100 | #292 | Tragic $35,777 |
| Guatemalans | 0.0 /100 | #293 | Tragic $35,695 |
| Cheyenne | 0.0 /100 | #294 | Tragic $35,673 |
| Comanche | 0.0 /100 | #295 | Tragic $35,661 |
| Mexican American Indians | 0.0 /100 | #296 | Tragic $35,629 |
| Hmong | 0.0 /100 | #297 | Tragic $35,498 |
| Immigrants | Micronesia | 0.0 /100 | #298 | Tragic $35,477 |
| Immigrants | Guatemala | 0.0 /100 | #299 | Tragic $35,444 |
| Yuman | 0.0 /100 | #300 | Tragic $35,377 |
| Pima | 0.0 /100 | #301 | Tragic $35,326 |
| Blacks/African Americans | 0.0 /100 | #302 | Tragic $35,315 |
| Immigrants | Latin America | 0.0 /100 | #303 | Tragic $35,307 |
| Crow | 0.0 /100 | #304 | Tragic $35,266 |