Nepalese vs European Median Female Earnings
COMPARE
Nepalese
European
Median Female Earnings
Median Female Earnings Comparison
Nepalese
Europeans
$38,603
MEDIAN FEMALE EARNINGS
9.3/ 100
METRIC RATING
219th/ 347
METRIC RANK
$39,457
MEDIAN FEMALE EARNINGS
37.7/ 100
METRIC RATING
184th/ 347
METRIC RANK
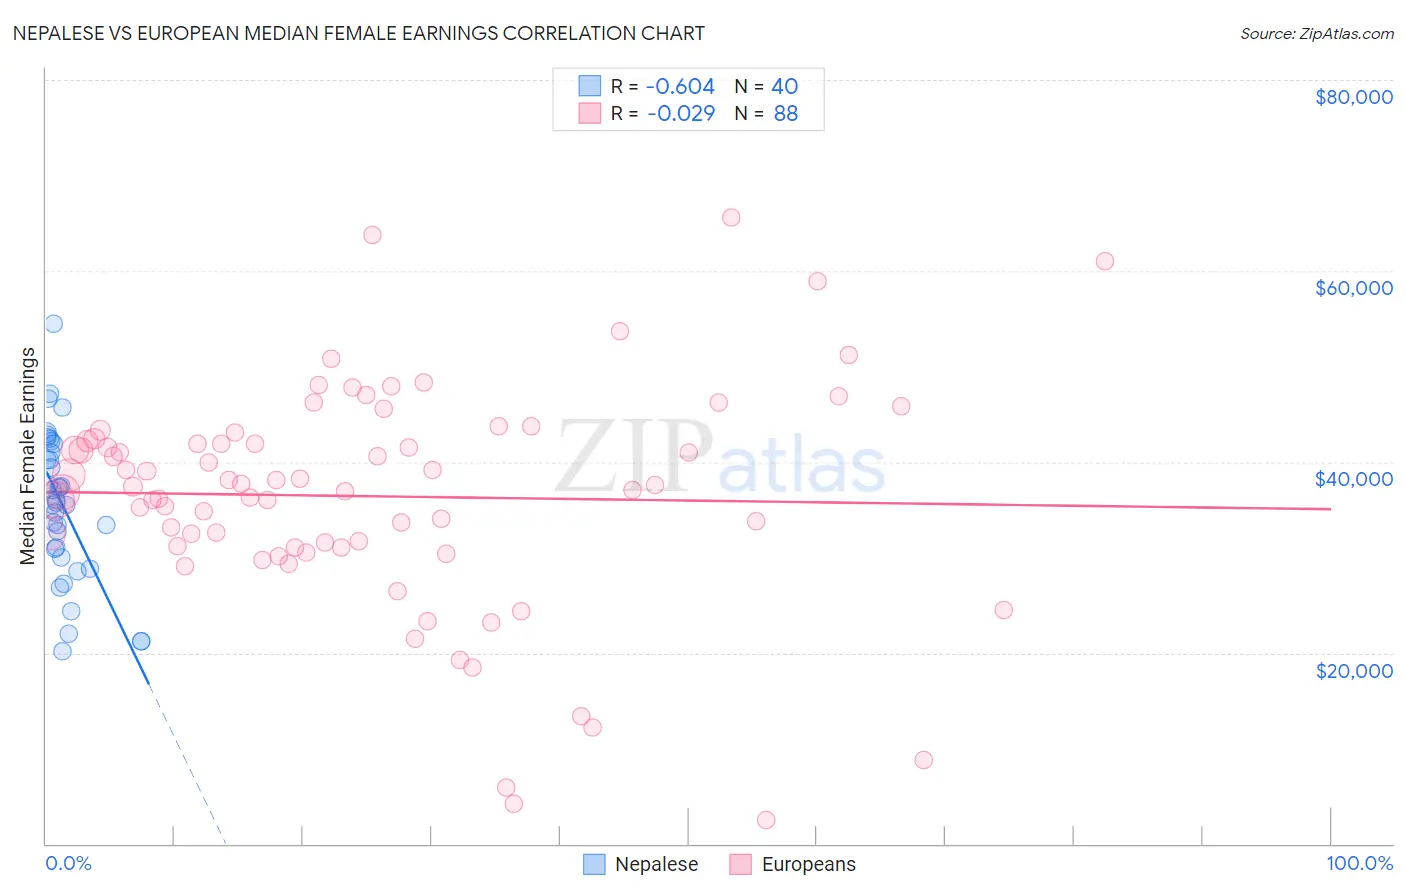
Nepalese vs European Median Female Earnings Correlation Chart
The statistical analysis conducted on geographies consisting of 24,521,755 people shows a significant negative correlation between the proportion of Nepalese and median female earnings in the United States with a correlation coefficient (R) of -0.604 and weighted average of $38,603. Similarly, the statistical analysis conducted on geographies consisting of 560,435,865 people shows no correlation between the proportion of Europeans and median female earnings in the United States with a correlation coefficient (R) of -0.029 and weighted average of $39,457, a difference of 2.2%.
Median Female Earnings Correlation Summary
| Measurement | Nepalese | European |
| Minimum | $20,210 | $2,499 |
| Maximum | $54,407 | $65,560 |
| Range | $34,197 | $63,061 |
| Mean | $35,483 | $36,392 |
| Median | $35,860 | $37,518 |
| Interquartile 25% (IQ1) | $30,426 | $31,126 |
| Interquartile 75% (IQ3) | $41,423 | $42,307 |
| Interquartile Range (IQR) | $10,997 | $11,181 |
| Standard Deviation (Sample) | $7,837 | $11,839 |
| Standard Deviation (Population) | $7,738 | $11,771 |
Similar Demographics by Median Female Earnings
Demographics Similar to Nepalese by Median Female Earnings
In terms of median female earnings, the demographic groups most similar to Nepalese are Cape Verdean ($38,614, a difference of 0.030%), Immigrants from Jamaica ($38,625, a difference of 0.060%), Yugoslavian ($38,573, a difference of 0.080%), Immigrants from the Azores ($38,573, a difference of 0.080%), and Immigrants from Ecuador ($38,644, a difference of 0.11%).
| Demographics | Rating | Rank | Median Female Earnings |
| Guamanians/Chamorros | 11.5 /100 | #212 | Poor $38,717 |
| Jamaicans | 10.5 /100 | #213 | Poor $38,670 |
| Iraqis | 10.5 /100 | #214 | Poor $38,666 |
| Spaniards | 10.3 /100 | #215 | Poor $38,656 |
| Immigrants | Ecuador | 10.1 /100 | #216 | Poor $38,644 |
| Immigrants | Jamaica | 9.7 /100 | #217 | Tragic $38,625 |
| Cape Verdeans | 9.5 /100 | #218 | Tragic $38,614 |
| Nepalese | 9.3 /100 | #219 | Tragic $38,603 |
| Yugoslavians | 8.8 /100 | #220 | Tragic $38,573 |
| Immigrants | Azores | 8.8 /100 | #221 | Tragic $38,573 |
| Japanese | 8.1 /100 | #222 | Tragic $38,528 |
| Immigrants | Sudan | 7.8 /100 | #223 | Tragic $38,511 |
| Native Hawaiians | 7.1 /100 | #224 | Tragic $38,461 |
| French | 7.0 /100 | #225 | Tragic $38,457 |
| French Canadians | 6.8 /100 | #226 | Tragic $38,436 |
Demographics Similar to Europeans by Median Female Earnings
In terms of median female earnings, the demographic groups most similar to Europeans are Immigrants from West Indies ($39,441, a difference of 0.040%), Colombian ($39,439, a difference of 0.040%), Swedish ($39,421, a difference of 0.090%), Bermudan ($39,418, a difference of 0.10%), and Hungarian ($39,510, a difference of 0.13%).
| Demographics | Rating | Rank | Median Female Earnings |
| Costa Ricans | 46.1 /100 | #177 | Average $39,622 |
| Slavs | 45.6 /100 | #178 | Average $39,613 |
| Immigrants | Germany | 45.1 /100 | #179 | Average $39,603 |
| Immigrants | Kenya | 41.6 /100 | #180 | Average $39,535 |
| Tsimshian | 41.4 /100 | #181 | Average $39,530 |
| Tlingit-Haida | 40.5 /100 | #182 | Average $39,513 |
| Hungarians | 40.3 /100 | #183 | Average $39,510 |
| Europeans | 37.7 /100 | #184 | Fair $39,457 |
| Immigrants | West Indies | 36.9 /100 | #185 | Fair $39,441 |
| Colombians | 36.9 /100 | #186 | Fair $39,439 |
| Swedes | 36.0 /100 | #187 | Fair $39,421 |
| Bermudans | 35.9 /100 | #188 | Fair $39,418 |
| Senegalese | 34.2 /100 | #189 | Fair $39,384 |
| Puget Sound Salish | 33.9 /100 | #190 | Fair $39,376 |
| Immigrants | Western Africa | 32.7 /100 | #191 | Fair $39,351 |