Immigrants from Zaire vs Immigrants from Eritrea Median Earnings
COMPARE
Immigrants from Zaire
Immigrants from Eritrea
Median Earnings
Median Earnings Comparison
Immigrants from Zaire
Immigrants from Eritrea
$41,325
MEDIAN EARNINGS
0.1/ 100
METRIC RATING
293rd/ 347
METRIC RANK
$47,657
MEDIAN EARNINGS
84.8/ 100
METRIC RATING
148th/ 347
METRIC RANK
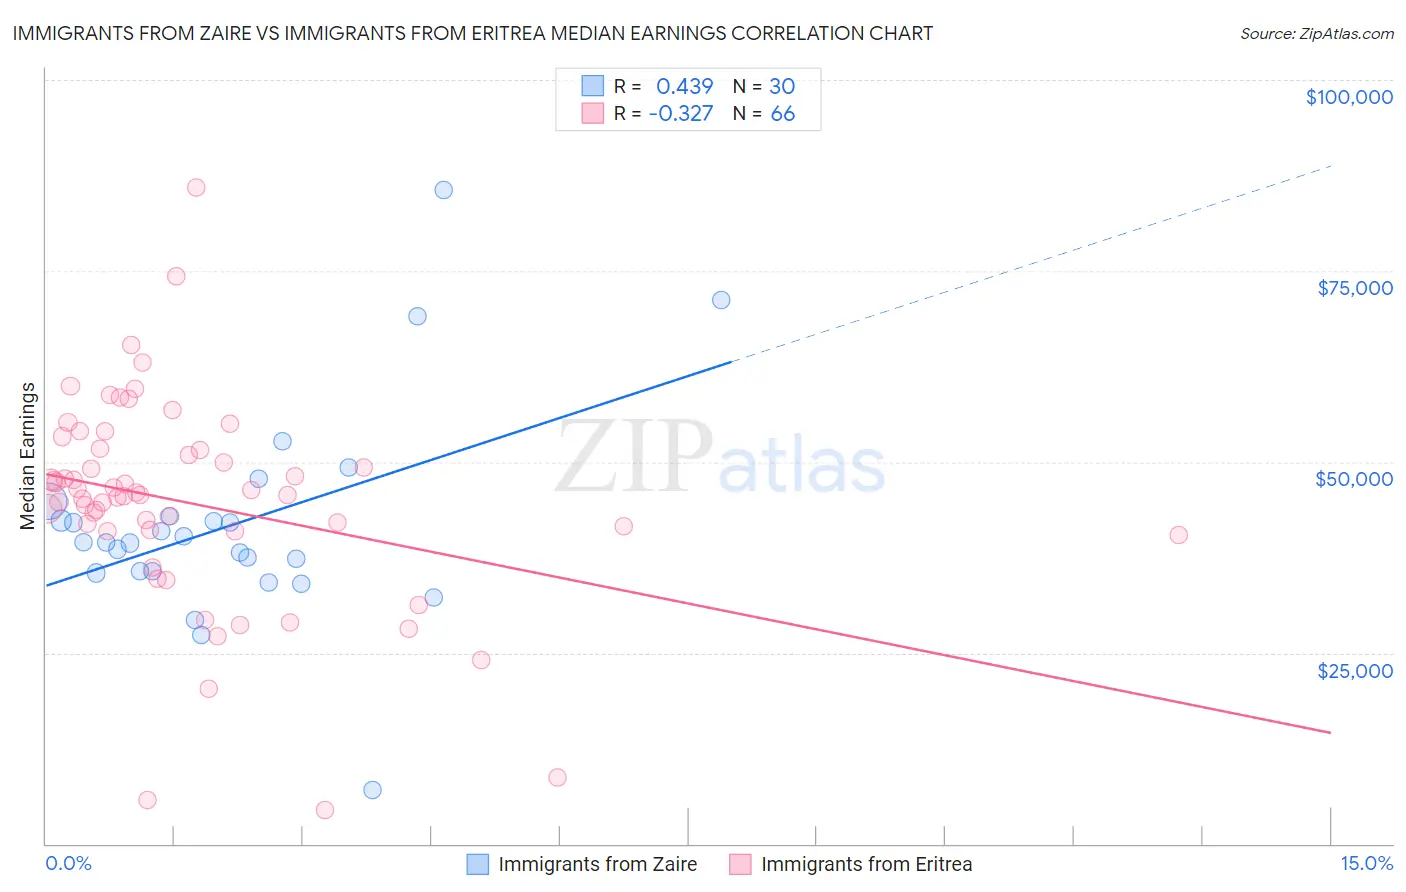
Immigrants from Zaire vs Immigrants from Eritrea Median Earnings Correlation Chart
The statistical analysis conducted on geographies consisting of 107,255,584 people shows a moderate positive correlation between the proportion of Immigrants from Zaire and median earnings in the United States with a correlation coefficient (R) of 0.439 and weighted average of $41,325. Similarly, the statistical analysis conducted on geographies consisting of 104,854,314 people shows a mild negative correlation between the proportion of Immigrants from Eritrea and median earnings in the United States with a correlation coefficient (R) of -0.327 and weighted average of $47,657, a difference of 15.3%.
Median Earnings Correlation Summary
| Measurement | Immigrants from Zaire | Immigrants from Eritrea |
| Minimum | $7,065 | $4,426 |
| Maximum | $85,536 | $85,924 |
| Range | $78,471 | $81,498 |
| Mean | $41,788 | $44,557 |
| Median | $39,475 | $45,626 |
| Interquartile 25% (IQ1) | $35,616 | $40,964 |
| Interquartile 75% (IQ3) | $42,826 | $51,547 |
| Interquartile Range (IQR) | $7,210 | $10,583 |
| Standard Deviation (Sample) | $14,049 | $13,912 |
| Standard Deviation (Population) | $13,813 | $13,806 |
Similar Demographics by Median Earnings
Demographics Similar to Immigrants from Zaire by Median Earnings
In terms of median earnings, the demographic groups most similar to Immigrants from Zaire are Potawatomi ($41,288, a difference of 0.090%), Bangladeshi ($41,263, a difference of 0.15%), Cherokee ($41,252, a difference of 0.18%), Guatemalan ($41,205, a difference of 0.29%), and U.S. Virgin Islander ($41,448, a difference of 0.30%).
| Demographics | Rating | Rank | Median Earnings |
| Mexican American Indians | 0.1 /100 | #286 | Tragic $41,719 |
| Indonesians | 0.1 /100 | #287 | Tragic $41,701 |
| Immigrants | Dominican Republic | 0.1 /100 | #288 | Tragic $41,554 |
| Comanche | 0.1 /100 | #289 | Tragic $41,519 |
| Paiute | 0.1 /100 | #290 | Tragic $41,508 |
| Central American Indians | 0.1 /100 | #291 | Tragic $41,474 |
| U.S. Virgin Islanders | 0.1 /100 | #292 | Tragic $41,448 |
| Immigrants | Zaire | 0.1 /100 | #293 | Tragic $41,325 |
| Potawatomi | 0.1 /100 | #294 | Tragic $41,288 |
| Bangladeshis | 0.1 /100 | #295 | Tragic $41,263 |
| Cherokee | 0.1 /100 | #296 | Tragic $41,252 |
| Guatemalans | 0.1 /100 | #297 | Tragic $41,205 |
| Immigrants | Micronesia | 0.1 /100 | #298 | Tragic $41,133 |
| Immigrants | Caribbean | 0.1 /100 | #299 | Tragic $41,119 |
| Ute | 0.1 /100 | #300 | Tragic $41,051 |
Demographics Similar to Immigrants from Eritrea by Median Earnings
In terms of median earnings, the demographic groups most similar to Immigrants from Eritrea are Immigrants from South Eastern Asia ($47,671, a difference of 0.030%), Luxembourger ($47,640, a difference of 0.040%), Peruvian ($47,628, a difference of 0.060%), Immigrants from Chile ($47,697, a difference of 0.080%), and Immigrants from Oceania ($47,617, a difference of 0.080%).
| Demographics | Rating | Rank | Median Earnings |
| Immigrants | Sierra Leone | 88.3 /100 | #141 | Excellent $47,875 |
| Ugandans | 88.0 /100 | #142 | Excellent $47,854 |
| Swedes | 88.0 /100 | #143 | Excellent $47,851 |
| Hungarians | 87.1 /100 | #144 | Excellent $47,795 |
| Immigrants | Saudi Arabia | 85.6 /100 | #145 | Excellent $47,704 |
| Immigrants | Chile | 85.5 /100 | #146 | Excellent $47,697 |
| Immigrants | South Eastern Asia | 85.0 /100 | #147 | Excellent $47,671 |
| Immigrants | Eritrea | 84.8 /100 | #148 | Excellent $47,657 |
| Luxembourgers | 84.5 /100 | #149 | Excellent $47,640 |
| Peruvians | 84.2 /100 | #150 | Excellent $47,628 |
| Immigrants | Oceania | 84.1 /100 | #151 | Excellent $47,617 |
| Immigrants | Germany | 83.1 /100 | #152 | Excellent $47,566 |
| Slavs | 81.1 /100 | #153 | Excellent $47,470 |
| Immigrants | Portugal | 77.3 /100 | #154 | Good $47,304 |
| Immigrants | Vietnam | 76.7 /100 | #155 | Good $47,282 |