Immigrants from Zaire vs Immigrants from Denmark Median Earnings
COMPARE
Immigrants from Zaire
Immigrants from Denmark
Median Earnings
Median Earnings Comparison
Immigrants from Zaire
Immigrants from Denmark
$41,325
MEDIAN EARNINGS
0.1/ 100
METRIC RATING
293rd/ 347
METRIC RANK
$53,186
MEDIAN EARNINGS
100.0/ 100
METRIC RATING
36th/ 347
METRIC RANK
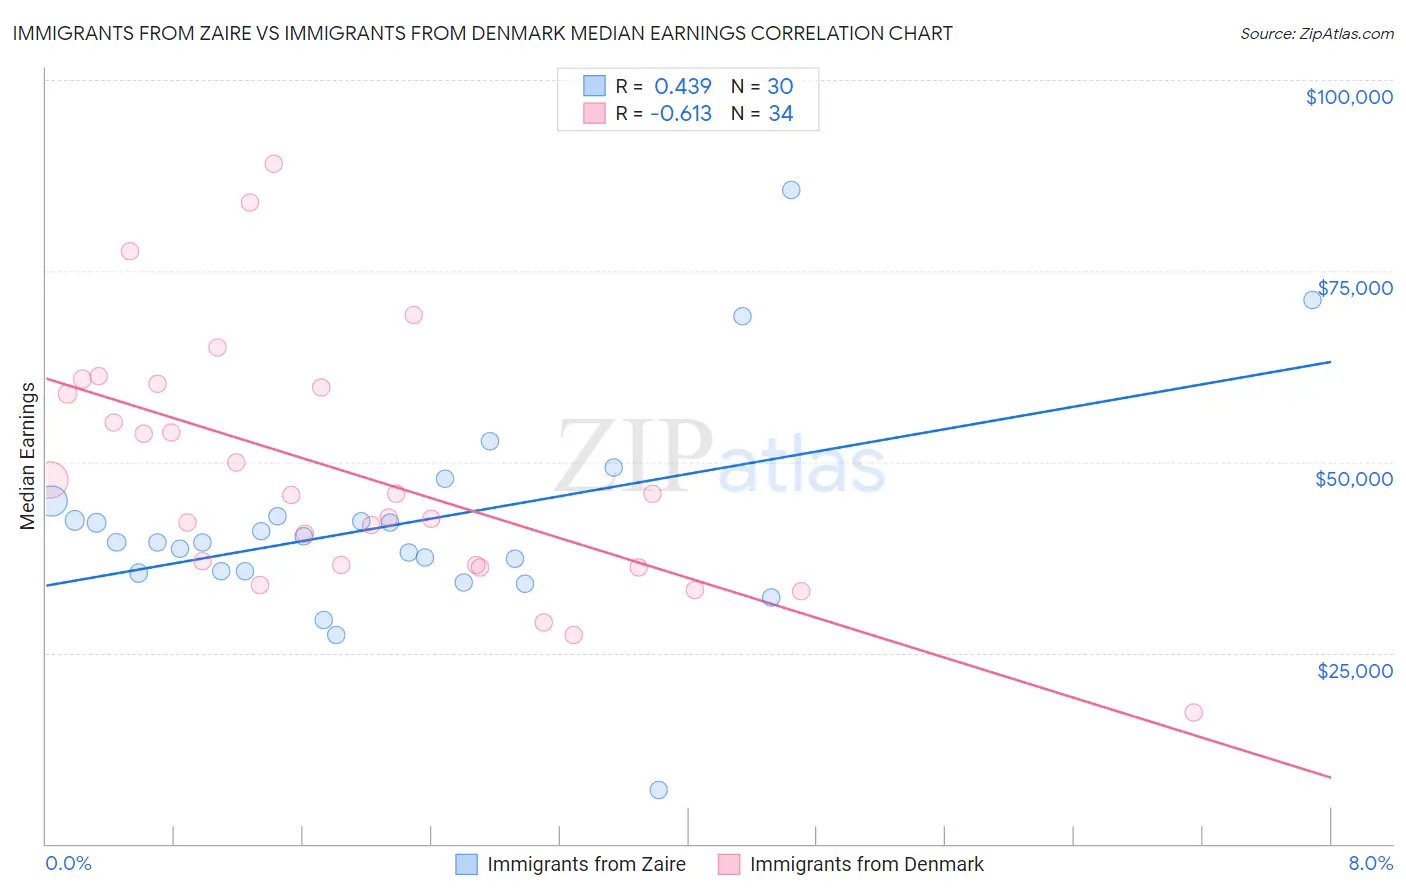
Immigrants from Zaire vs Immigrants from Denmark Median Earnings Correlation Chart
The statistical analysis conducted on geographies consisting of 107,255,584 people shows a moderate positive correlation between the proportion of Immigrants from Zaire and median earnings in the United States with a correlation coefficient (R) of 0.439 and weighted average of $41,325. Similarly, the statistical analysis conducted on geographies consisting of 136,423,232 people shows a significant negative correlation between the proportion of Immigrants from Denmark and median earnings in the United States with a correlation coefficient (R) of -0.613 and weighted average of $53,186, a difference of 28.7%.
Median Earnings Correlation Summary
| Measurement | Immigrants from Zaire | Immigrants from Denmark |
| Minimum | $7,065 | $17,222 |
| Maximum | $85,536 | $89,094 |
| Range | $78,471 | $71,872 |
| Mean | $41,788 | $48,495 |
| Median | $39,475 | $45,741 |
| Interquartile 25% (IQ1) | $35,616 | $36,425 |
| Interquartile 75% (IQ3) | $42,826 | $59,711 |
| Interquartile Range (IQR) | $7,210 | $23,286 |
| Standard Deviation (Sample) | $14,049 | $16,233 |
| Standard Deviation (Population) | $13,813 | $15,992 |
Similar Demographics by Median Earnings
Demographics Similar to Immigrants from Zaire by Median Earnings
In terms of median earnings, the demographic groups most similar to Immigrants from Zaire are Potawatomi ($41,288, a difference of 0.090%), Bangladeshi ($41,263, a difference of 0.15%), Cherokee ($41,252, a difference of 0.18%), Guatemalan ($41,205, a difference of 0.29%), and U.S. Virgin Islander ($41,448, a difference of 0.30%).
| Demographics | Rating | Rank | Median Earnings |
| Mexican American Indians | 0.1 /100 | #286 | Tragic $41,719 |
| Indonesians | 0.1 /100 | #287 | Tragic $41,701 |
| Immigrants | Dominican Republic | 0.1 /100 | #288 | Tragic $41,554 |
| Comanche | 0.1 /100 | #289 | Tragic $41,519 |
| Paiute | 0.1 /100 | #290 | Tragic $41,508 |
| Central American Indians | 0.1 /100 | #291 | Tragic $41,474 |
| U.S. Virgin Islanders | 0.1 /100 | #292 | Tragic $41,448 |
| Immigrants | Zaire | 0.1 /100 | #293 | Tragic $41,325 |
| Potawatomi | 0.1 /100 | #294 | Tragic $41,288 |
| Bangladeshis | 0.1 /100 | #295 | Tragic $41,263 |
| Cherokee | 0.1 /100 | #296 | Tragic $41,252 |
| Guatemalans | 0.1 /100 | #297 | Tragic $41,205 |
| Immigrants | Micronesia | 0.1 /100 | #298 | Tragic $41,133 |
| Immigrants | Caribbean | 0.1 /100 | #299 | Tragic $41,119 |
| Ute | 0.1 /100 | #300 | Tragic $41,051 |
Demographics Similar to Immigrants from Denmark by Median Earnings
In terms of median earnings, the demographic groups most similar to Immigrants from Denmark are Immigrants from Switzerland ($53,211, a difference of 0.050%), Immigrants from Sri Lanka ($53,268, a difference of 0.15%), Immigrants from Greece ($53,282, a difference of 0.18%), Immigrants from Asia ($53,310, a difference of 0.23%), and Immigrants from Belarus ($53,043, a difference of 0.27%).
| Demographics | Rating | Rank | Median Earnings |
| Immigrants | Russia | 100.0 /100 | #29 | Exceptional $53,457 |
| Cambodians | 100.0 /100 | #30 | Exceptional $53,386 |
| Russians | 100.0 /100 | #31 | Exceptional $53,334 |
| Immigrants | Asia | 100.0 /100 | #32 | Exceptional $53,310 |
| Immigrants | Greece | 100.0 /100 | #33 | Exceptional $53,282 |
| Immigrants | Sri Lanka | 100.0 /100 | #34 | Exceptional $53,268 |
| Immigrants | Switzerland | 100.0 /100 | #35 | Exceptional $53,211 |
| Immigrants | Denmark | 100.0 /100 | #36 | Exceptional $53,186 |
| Immigrants | Belarus | 100.0 /100 | #37 | Exceptional $53,043 |
| Latvians | 100.0 /100 | #38 | Exceptional $53,001 |
| Immigrants | Turkey | 100.0 /100 | #39 | Exceptional $52,960 |
| Israelis | 100.0 /100 | #40 | Exceptional $52,937 |
| Immigrants | Lithuania | 100.0 /100 | #41 | Exceptional $52,769 |
| Maltese | 100.0 /100 | #42 | Exceptional $52,526 |
| Immigrants | Malaysia | 100.0 /100 | #43 | Exceptional $52,514 |