Zimbabwean vs Immigrants from Eritrea Median Earnings
COMPARE
Zimbabwean
Immigrants from Eritrea
Median Earnings
Median Earnings Comparison
Zimbabweans
Immigrants from Eritrea
$48,229
MEDIAN EARNINGS
92.6/ 100
METRIC RATING
130th/ 347
METRIC RANK
$47,657
MEDIAN EARNINGS
84.8/ 100
METRIC RATING
148th/ 347
METRIC RANK
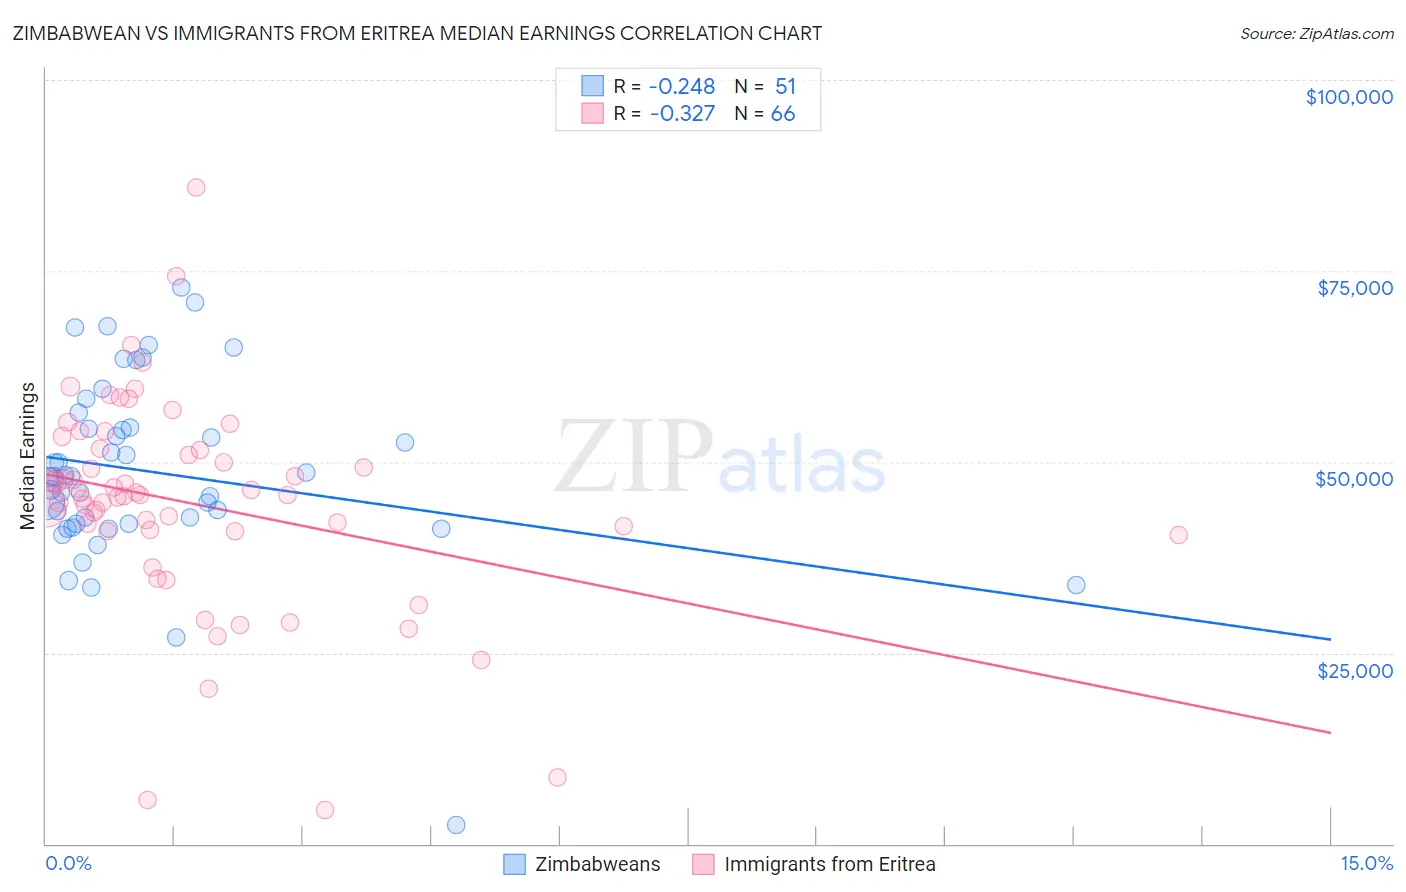
Zimbabwean vs Immigrants from Eritrea Median Earnings Correlation Chart
The statistical analysis conducted on geographies consisting of 69,206,617 people shows a weak negative correlation between the proportion of Zimbabweans and median earnings in the United States with a correlation coefficient (R) of -0.248 and weighted average of $48,229. Similarly, the statistical analysis conducted on geographies consisting of 104,854,314 people shows a mild negative correlation between the proportion of Immigrants from Eritrea and median earnings in the United States with a correlation coefficient (R) of -0.327 and weighted average of $47,657, a difference of 1.2%.
Median Earnings Correlation Summary
| Measurement | Zimbabwean | Immigrants from Eritrea |
| Minimum | $2,499 | $4,426 |
| Maximum | $72,836 | $85,924 |
| Range | $70,337 | $81,498 |
| Mean | $48,668 | $44,557 |
| Median | $48,062 | $45,626 |
| Interquartile 25% (IQ1) | $41,953 | $40,964 |
| Interquartile 75% (IQ3) | $54,537 | $51,547 |
| Interquartile Range (IQR) | $12,584 | $10,583 |
| Standard Deviation (Sample) | $12,230 | $13,912 |
| Standard Deviation (Population) | $12,110 | $13,806 |
Demographics Similar to Zimbabweans and Immigrants from Eritrea by Median Earnings
In terms of median earnings, the demographic groups most similar to Zimbabweans are Lebanese ($48,226, a difference of 0.010%), Pakistani ($48,254, a difference of 0.050%), British ($48,189, a difference of 0.080%), Immigrants from Uganda ($48,041, a difference of 0.39%), and Sri Lankan ($48,040, a difference of 0.39%). Similarly, the demographic groups most similar to Immigrants from Eritrea are Immigrants from South Eastern Asia ($47,671, a difference of 0.030%), Luxembourger ($47,640, a difference of 0.040%), Immigrants from Chile ($47,697, a difference of 0.080%), Immigrants from Saudi Arabia ($47,704, a difference of 0.10%), and Hungarian ($47,795, a difference of 0.29%).
| Demographics | Rating | Rank | Median Earnings |
| Pakistanis | 92.8 /100 | #129 | Exceptional $48,254 |
| Zimbabweans | 92.6 /100 | #130 | Exceptional $48,229 |
| Lebanese | 92.5 /100 | #131 | Exceptional $48,226 |
| British | 92.2 /100 | #132 | Exceptional $48,189 |
| Immigrants | Uganda | 90.5 /100 | #133 | Exceptional $48,041 |
| Sri Lankans | 90.5 /100 | #134 | Exceptional $48,040 |
| Portuguese | 90.4 /100 | #135 | Exceptional $48,032 |
| Slovenes | 90.0 /100 | #136 | Excellent $47,995 |
| Immigrants | Nepal | 89.0 /100 | #137 | Excellent $47,925 |
| Europeans | 88.9 /100 | #138 | Excellent $47,915 |
| Canadians | 88.8 /100 | #139 | Excellent $47,911 |
| Taiwanese | 88.7 /100 | #140 | Excellent $47,902 |
| Immigrants | Sierra Leone | 88.3 /100 | #141 | Excellent $47,875 |
| Ugandans | 88.0 /100 | #142 | Excellent $47,854 |
| Swedes | 88.0 /100 | #143 | Excellent $47,851 |
| Hungarians | 87.1 /100 | #144 | Excellent $47,795 |
| Immigrants | Saudi Arabia | 85.6 /100 | #145 | Excellent $47,704 |
| Immigrants | Chile | 85.5 /100 | #146 | Excellent $47,697 |
| Immigrants | South Eastern Asia | 85.0 /100 | #147 | Excellent $47,671 |
| Immigrants | Eritrea | 84.8 /100 | #148 | Excellent $47,657 |
| Luxembourgers | 84.5 /100 | #149 | Excellent $47,640 |