Immigrants from Zaire vs Immigrants from Bulgaria Median Earnings
COMPARE
Immigrants from Zaire
Immigrants from Bulgaria
Median Earnings
Median Earnings Comparison
Immigrants from Zaire
Immigrants from Bulgaria
$41,325
MEDIAN EARNINGS
0.1/ 100
METRIC RATING
293rd/ 347
METRIC RANK
$51,318
MEDIAN EARNINGS
99.9/ 100
METRIC RATING
63rd/ 347
METRIC RANK
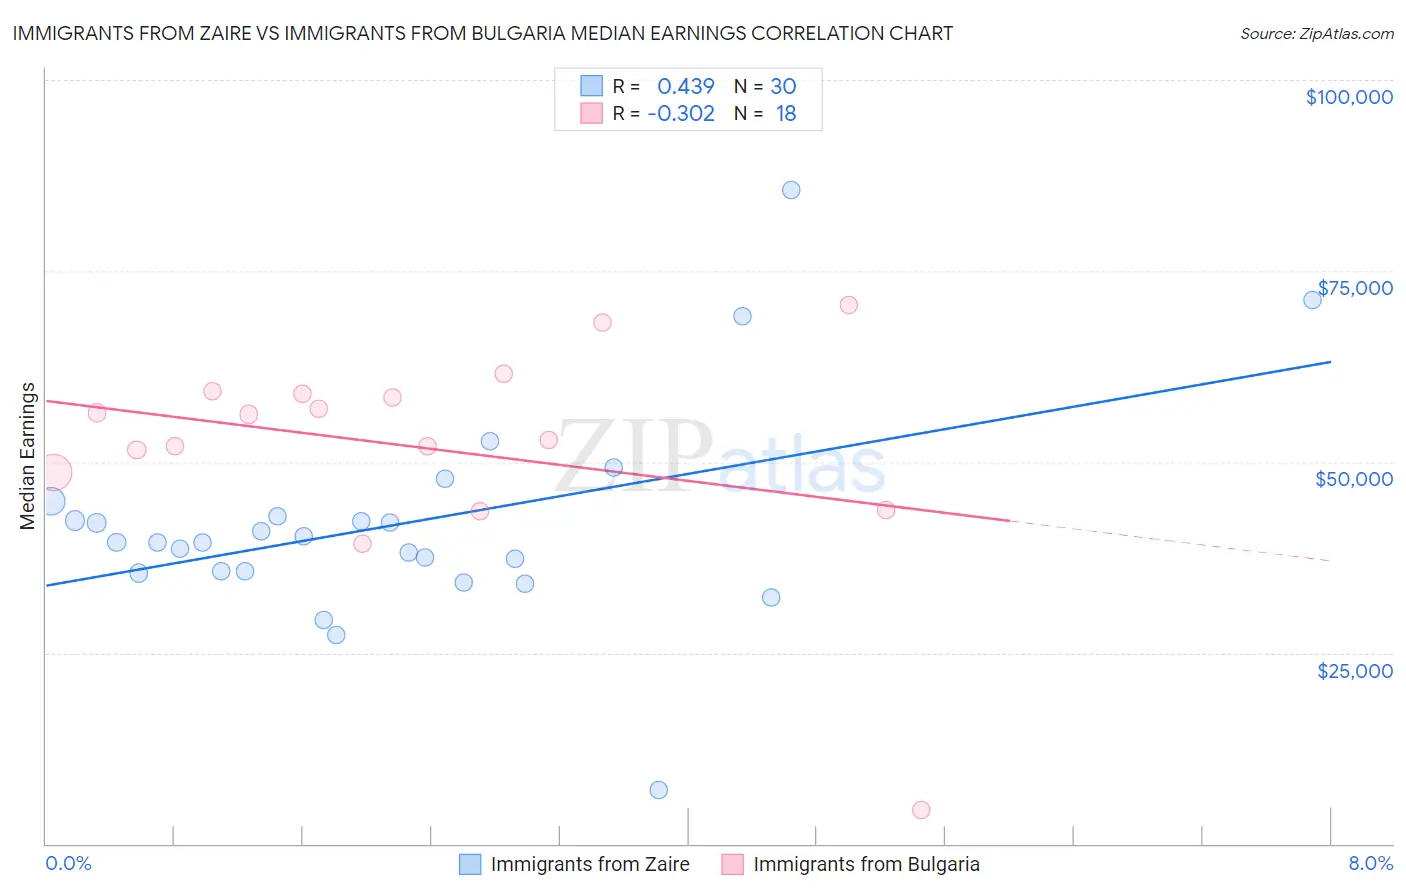
Immigrants from Zaire vs Immigrants from Bulgaria Median Earnings Correlation Chart
The statistical analysis conducted on geographies consisting of 107,255,584 people shows a moderate positive correlation between the proportion of Immigrants from Zaire and median earnings in the United States with a correlation coefficient (R) of 0.439 and weighted average of $41,325. Similarly, the statistical analysis conducted on geographies consisting of 172,536,651 people shows a mild negative correlation between the proportion of Immigrants from Bulgaria and median earnings in the United States with a correlation coefficient (R) of -0.302 and weighted average of $51,318, a difference of 24.2%.
Median Earnings Correlation Summary
| Measurement | Immigrants from Zaire | Immigrants from Bulgaria |
| Minimum | $7,065 | $4,447 |
| Maximum | $85,536 | $70,600 |
| Range | $78,471 | $66,153 |
| Mean | $41,788 | $51,928 |
| Median | $39,475 | $54,557 |
| Interquartile 25% (IQ1) | $35,616 | $48,616 |
| Interquartile 75% (IQ3) | $42,826 | $58,987 |
| Interquartile Range (IQR) | $7,210 | $10,371 |
| Standard Deviation (Sample) | $14,049 | $14,304 |
| Standard Deviation (Population) | $13,813 | $13,901 |
Similar Demographics by Median Earnings
Demographics Similar to Immigrants from Zaire by Median Earnings
In terms of median earnings, the demographic groups most similar to Immigrants from Zaire are Potawatomi ($41,288, a difference of 0.090%), Bangladeshi ($41,263, a difference of 0.15%), Cherokee ($41,252, a difference of 0.18%), Guatemalan ($41,205, a difference of 0.29%), and U.S. Virgin Islander ($41,448, a difference of 0.30%).
| Demographics | Rating | Rank | Median Earnings |
| Mexican American Indians | 0.1 /100 | #286 | Tragic $41,719 |
| Indonesians | 0.1 /100 | #287 | Tragic $41,701 |
| Immigrants | Dominican Republic | 0.1 /100 | #288 | Tragic $41,554 |
| Comanche | 0.1 /100 | #289 | Tragic $41,519 |
| Paiute | 0.1 /100 | #290 | Tragic $41,508 |
| Central American Indians | 0.1 /100 | #291 | Tragic $41,474 |
| U.S. Virgin Islanders | 0.1 /100 | #292 | Tragic $41,448 |
| Immigrants | Zaire | 0.1 /100 | #293 | Tragic $41,325 |
| Potawatomi | 0.1 /100 | #294 | Tragic $41,288 |
| Bangladeshis | 0.1 /100 | #295 | Tragic $41,263 |
| Cherokee | 0.1 /100 | #296 | Tragic $41,252 |
| Guatemalans | 0.1 /100 | #297 | Tragic $41,205 |
| Immigrants | Micronesia | 0.1 /100 | #298 | Tragic $41,133 |
| Immigrants | Caribbean | 0.1 /100 | #299 | Tragic $41,119 |
| Ute | 0.1 /100 | #300 | Tragic $41,051 |
Demographics Similar to Immigrants from Bulgaria by Median Earnings
In terms of median earnings, the demographic groups most similar to Immigrants from Bulgaria are Immigrants from Romania ($51,337, a difference of 0.040%), New Zealander ($51,246, a difference of 0.14%), Greek ($51,164, a difference of 0.30%), Afghan ($51,112, a difference of 0.40%), and Immigrants from Spain ($51,092, a difference of 0.44%).
| Demographics | Rating | Rank | Median Earnings |
| Immigrants | Pakistan | 99.9 /100 | #56 | Exceptional $51,693 |
| Immigrants | Eastern Europe | 99.9 /100 | #57 | Exceptional $51,624 |
| Immigrants | Bolivia | 99.9 /100 | #58 | Exceptional $51,605 |
| Immigrants | Croatia | 99.9 /100 | #59 | Exceptional $51,581 |
| Immigrants | Serbia | 99.9 /100 | #60 | Exceptional $51,557 |
| Immigrants | Latvia | 99.9 /100 | #61 | Exceptional $51,555 |
| Immigrants | Romania | 99.9 /100 | #62 | Exceptional $51,337 |
| Immigrants | Bulgaria | 99.9 /100 | #63 | Exceptional $51,318 |
| New Zealanders | 99.9 /100 | #64 | Exceptional $51,246 |
| Greeks | 99.9 /100 | #65 | Exceptional $51,164 |
| Afghans | 99.9 /100 | #66 | Exceptional $51,112 |
| Immigrants | Spain | 99.9 /100 | #67 | Exceptional $51,092 |
| Paraguayans | 99.9 /100 | #68 | Exceptional $51,068 |
| Mongolians | 99.8 /100 | #69 | Exceptional $51,038 |
| Lithuanians | 99.8 /100 | #70 | Exceptional $50,991 |