Immigrants from Mexico vs Immigrants from Eritrea Median Earnings
COMPARE
Immigrants from Mexico
Immigrants from Eritrea
Median Earnings
Median Earnings Comparison
Immigrants from Mexico
Immigrants from Eritrea
$39,114
MEDIAN EARNINGS
0.0/ 100
METRIC RATING
331st/ 347
METRIC RANK
$47,657
MEDIAN EARNINGS
84.8/ 100
METRIC RATING
148th/ 347
METRIC RANK
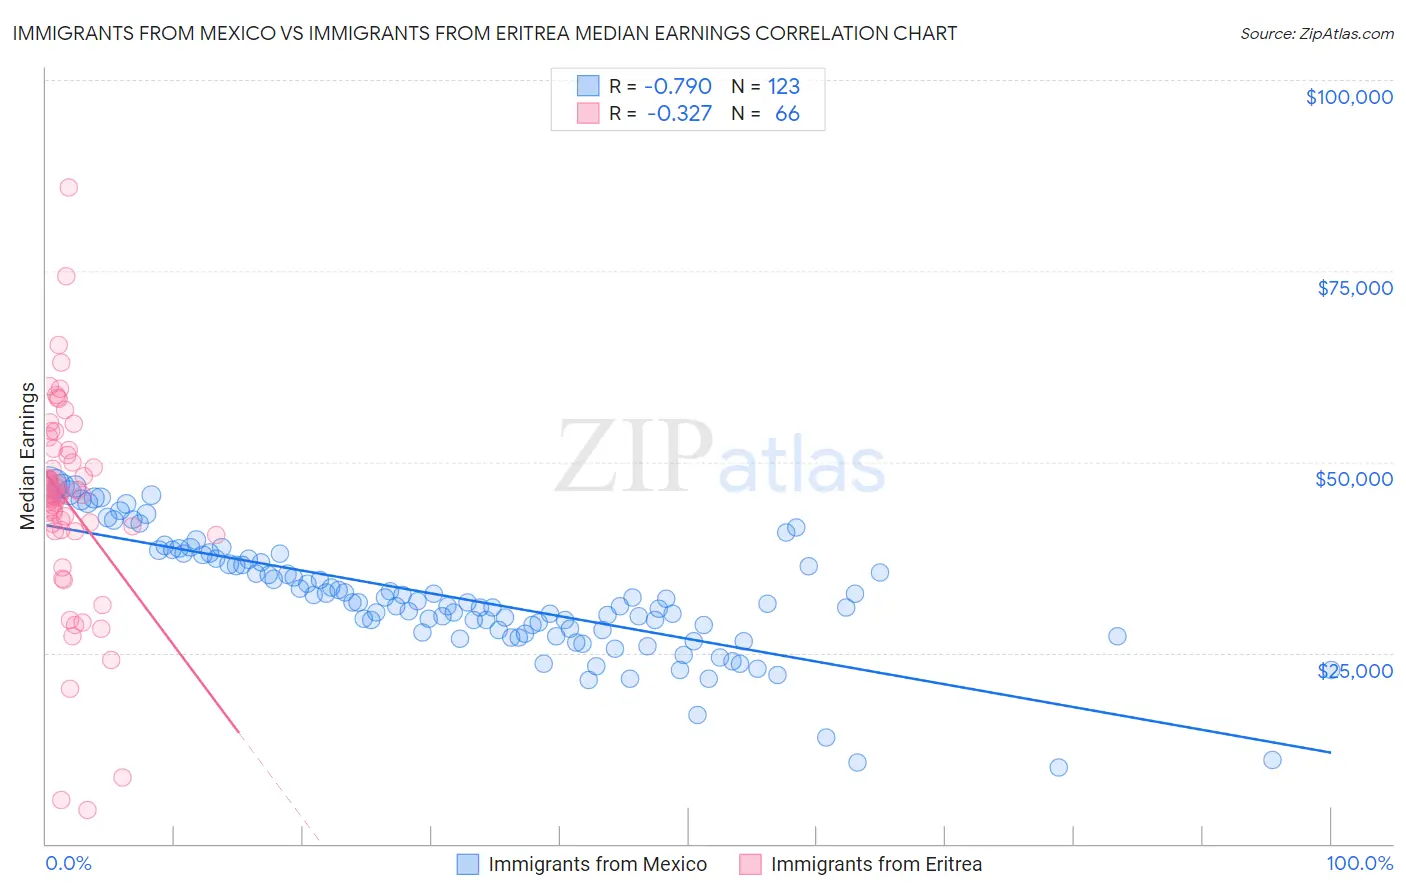
Immigrants from Mexico vs Immigrants from Eritrea Median Earnings Correlation Chart
The statistical analysis conducted on geographies consisting of 513,570,103 people shows a strong negative correlation between the proportion of Immigrants from Mexico and median earnings in the United States with a correlation coefficient (R) of -0.790 and weighted average of $39,114. Similarly, the statistical analysis conducted on geographies consisting of 104,854,314 people shows a mild negative correlation between the proportion of Immigrants from Eritrea and median earnings in the United States with a correlation coefficient (R) of -0.327 and weighted average of $47,657, a difference of 21.8%.
Median Earnings Correlation Summary
| Measurement | Immigrants from Mexico | Immigrants from Eritrea |
| Minimum | $9,917 | $4,426 |
| Maximum | $47,055 | $85,924 |
| Range | $37,138 | $81,498 |
| Mean | $32,176 | $44,557 |
| Median | $31,534 | $45,626 |
| Interquartile 25% (IQ1) | $27,679 | $40,964 |
| Interquartile 75% (IQ3) | $37,374 | $51,547 |
| Interquartile Range (IQR) | $9,695 | $10,583 |
| Standard Deviation (Sample) | $7,708 | $13,912 |
| Standard Deviation (Population) | $7,676 | $13,806 |
Similar Demographics by Median Earnings
Demographics Similar to Immigrants from Mexico by Median Earnings
In terms of median earnings, the demographic groups most similar to Immigrants from Mexico are Yakama ($39,107, a difference of 0.020%), Immigrants from Congo ($39,169, a difference of 0.14%), Kiowa ($39,232, a difference of 0.30%), Houma ($38,949, a difference of 0.42%), and Spanish American Indian ($38,907, a difference of 0.53%).
| Demographics | Rating | Rank | Median Earnings |
| Ottawa | 0.0 /100 | #324 | Tragic $39,721 |
| Creek | 0.0 /100 | #325 | Tragic $39,648 |
| Immigrants | Yemen | 0.0 /100 | #326 | Tragic $39,540 |
| Yuman | 0.0 /100 | #327 | Tragic $39,523 |
| Sioux | 0.0 /100 | #328 | Tragic $39,448 |
| Kiowa | 0.0 /100 | #329 | Tragic $39,232 |
| Immigrants | Congo | 0.0 /100 | #330 | Tragic $39,169 |
| Immigrants | Mexico | 0.0 /100 | #331 | Tragic $39,114 |
| Yakama | 0.0 /100 | #332 | Tragic $39,107 |
| Houma | 0.0 /100 | #333 | Tragic $38,949 |
| Spanish American Indians | 0.0 /100 | #334 | Tragic $38,907 |
| Natives/Alaskans | 0.0 /100 | #335 | Tragic $38,896 |
| Crow | 0.0 /100 | #336 | Tragic $38,707 |
| Immigrants | Cuba | 0.0 /100 | #337 | Tragic $38,426 |
| Pima | 0.0 /100 | #338 | Tragic $38,285 |
Demographics Similar to Immigrants from Eritrea by Median Earnings
In terms of median earnings, the demographic groups most similar to Immigrants from Eritrea are Immigrants from South Eastern Asia ($47,671, a difference of 0.030%), Luxembourger ($47,640, a difference of 0.040%), Peruvian ($47,628, a difference of 0.060%), Immigrants from Chile ($47,697, a difference of 0.080%), and Immigrants from Oceania ($47,617, a difference of 0.080%).
| Demographics | Rating | Rank | Median Earnings |
| Immigrants | Sierra Leone | 88.3 /100 | #141 | Excellent $47,875 |
| Ugandans | 88.0 /100 | #142 | Excellent $47,854 |
| Swedes | 88.0 /100 | #143 | Excellent $47,851 |
| Hungarians | 87.1 /100 | #144 | Excellent $47,795 |
| Immigrants | Saudi Arabia | 85.6 /100 | #145 | Excellent $47,704 |
| Immigrants | Chile | 85.5 /100 | #146 | Excellent $47,697 |
| Immigrants | South Eastern Asia | 85.0 /100 | #147 | Excellent $47,671 |
| Immigrants | Eritrea | 84.8 /100 | #148 | Excellent $47,657 |
| Luxembourgers | 84.5 /100 | #149 | Excellent $47,640 |
| Peruvians | 84.2 /100 | #150 | Excellent $47,628 |
| Immigrants | Oceania | 84.1 /100 | #151 | Excellent $47,617 |
| Immigrants | Germany | 83.1 /100 | #152 | Excellent $47,566 |
| Slavs | 81.1 /100 | #153 | Excellent $47,470 |
| Immigrants | Portugal | 77.3 /100 | #154 | Good $47,304 |
| Immigrants | Vietnam | 76.7 /100 | #155 | Good $47,282 |