Immigrants from Zaire vs Immigrants from Peru Median Earnings
COMPARE
Immigrants from Zaire
Immigrants from Peru
Median Earnings
Median Earnings Comparison
Immigrants from Zaire
Immigrants from Peru
$41,325
MEDIAN EARNINGS
0.1/ 100
METRIC RATING
293rd/ 347
METRIC RANK
$47,025
MEDIAN EARNINGS
69.6/ 100
METRIC RATING
159th/ 347
METRIC RANK
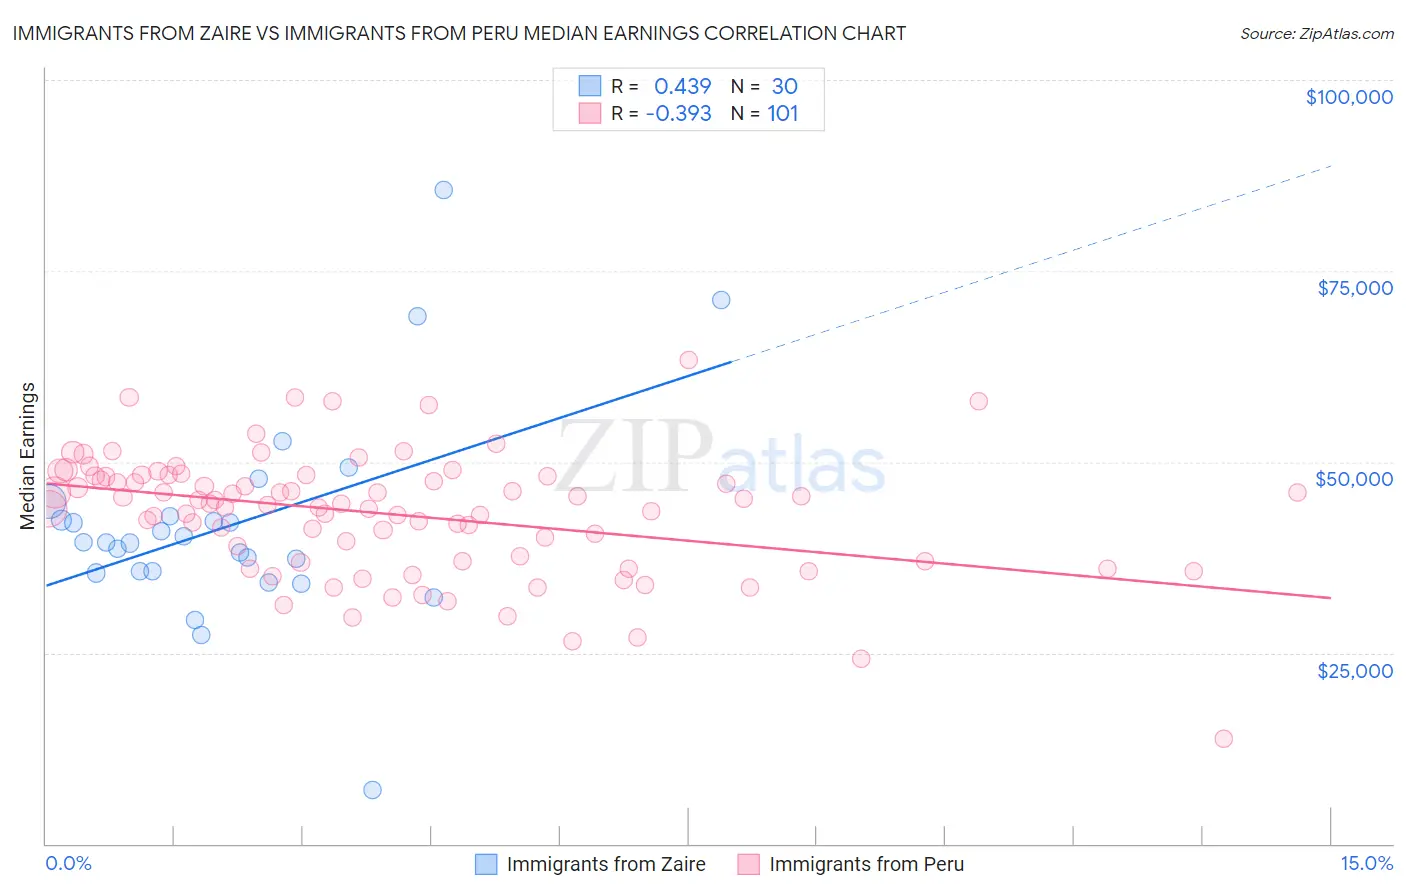
Immigrants from Zaire vs Immigrants from Peru Median Earnings Correlation Chart
The statistical analysis conducted on geographies consisting of 107,255,584 people shows a moderate positive correlation between the proportion of Immigrants from Zaire and median earnings in the United States with a correlation coefficient (R) of 0.439 and weighted average of $41,325. Similarly, the statistical analysis conducted on geographies consisting of 328,851,248 people shows a mild negative correlation between the proportion of Immigrants from Peru and median earnings in the United States with a correlation coefficient (R) of -0.393 and weighted average of $47,025, a difference of 13.8%.
Median Earnings Correlation Summary
| Measurement | Immigrants from Zaire | Immigrants from Peru |
| Minimum | $7,065 | $13,750 |
| Maximum | $85,536 | $63,387 |
| Range | $78,471 | $49,637 |
| Mean | $41,788 | $43,144 |
| Median | $39,475 | $44,577 |
| Interquartile 25% (IQ1) | $35,616 | $36,980 |
| Interquartile 75% (IQ3) | $42,826 | $48,145 |
| Interquartile Range (IQR) | $7,210 | $11,165 |
| Standard Deviation (Sample) | $14,049 | $8,031 |
| Standard Deviation (Population) | $13,813 | $7,991 |
Similar Demographics by Median Earnings
Demographics Similar to Immigrants from Zaire by Median Earnings
In terms of median earnings, the demographic groups most similar to Immigrants from Zaire are Potawatomi ($41,288, a difference of 0.090%), Bangladeshi ($41,263, a difference of 0.15%), Cherokee ($41,252, a difference of 0.18%), Guatemalan ($41,205, a difference of 0.29%), and U.S. Virgin Islander ($41,448, a difference of 0.30%).
| Demographics | Rating | Rank | Median Earnings |
| Mexican American Indians | 0.1 /100 | #286 | Tragic $41,719 |
| Indonesians | 0.1 /100 | #287 | Tragic $41,701 |
| Immigrants | Dominican Republic | 0.1 /100 | #288 | Tragic $41,554 |
| Comanche | 0.1 /100 | #289 | Tragic $41,519 |
| Paiute | 0.1 /100 | #290 | Tragic $41,508 |
| Central American Indians | 0.1 /100 | #291 | Tragic $41,474 |
| U.S. Virgin Islanders | 0.1 /100 | #292 | Tragic $41,448 |
| Immigrants | Zaire | 0.1 /100 | #293 | Tragic $41,325 |
| Potawatomi | 0.1 /100 | #294 | Tragic $41,288 |
| Bangladeshis | 0.1 /100 | #295 | Tragic $41,263 |
| Cherokee | 0.1 /100 | #296 | Tragic $41,252 |
| Guatemalans | 0.1 /100 | #297 | Tragic $41,205 |
| Immigrants | Micronesia | 0.1 /100 | #298 | Tragic $41,133 |
| Immigrants | Caribbean | 0.1 /100 | #299 | Tragic $41,119 |
| Ute | 0.1 /100 | #300 | Tragic $41,051 |
Demographics Similar to Immigrants from Peru by Median Earnings
In terms of median earnings, the demographic groups most similar to Immigrants from Peru are Alsatian ($47,023, a difference of 0.0%), Immigrants from Eastern Africa ($46,969, a difference of 0.12%), Slovak ($47,095, a difference of 0.15%), South American Indian ($46,952, a difference of 0.16%), and Icelander ($46,916, a difference of 0.23%).
| Demographics | Rating | Rank | Median Earnings |
| Immigrants | Germany | 83.1 /100 | #152 | Excellent $47,566 |
| Slavs | 81.1 /100 | #153 | Excellent $47,470 |
| Immigrants | Portugal | 77.3 /100 | #154 | Good $47,304 |
| Immigrants | Vietnam | 76.7 /100 | #155 | Good $47,282 |
| Irish | 76.6 /100 | #156 | Good $47,276 |
| Czechs | 75.1 /100 | #157 | Good $47,221 |
| Slovaks | 71.7 /100 | #158 | Good $47,095 |
| Immigrants | Peru | 69.6 /100 | #159 | Good $47,025 |
| Alsatians | 69.6 /100 | #160 | Good $47,023 |
| Immigrants | Eastern Africa | 68.0 /100 | #161 | Good $46,969 |
| South American Indians | 67.4 /100 | #162 | Good $46,952 |
| Icelanders | 66.3 /100 | #163 | Good $46,916 |
| Norwegians | 64.7 /100 | #164 | Good $46,865 |
| South Americans | 62.7 /100 | #165 | Good $46,804 |
| Czechoslovakians | 57.8 /100 | #166 | Average $46,658 |