Immigrants from Zaire vs Immigrants from Bahamas Median Earnings
COMPARE
Immigrants from Zaire
Immigrants from Bahamas
Median Earnings
Median Earnings Comparison
Immigrants from Zaire
Immigrants from Bahamas
$41,325
MEDIAN EARNINGS
0.1/ 100
METRIC RATING
293rd/ 347
METRIC RANK
$39,861
MEDIAN EARNINGS
0.0/ 100
METRIC RATING
320th/ 347
METRIC RANK
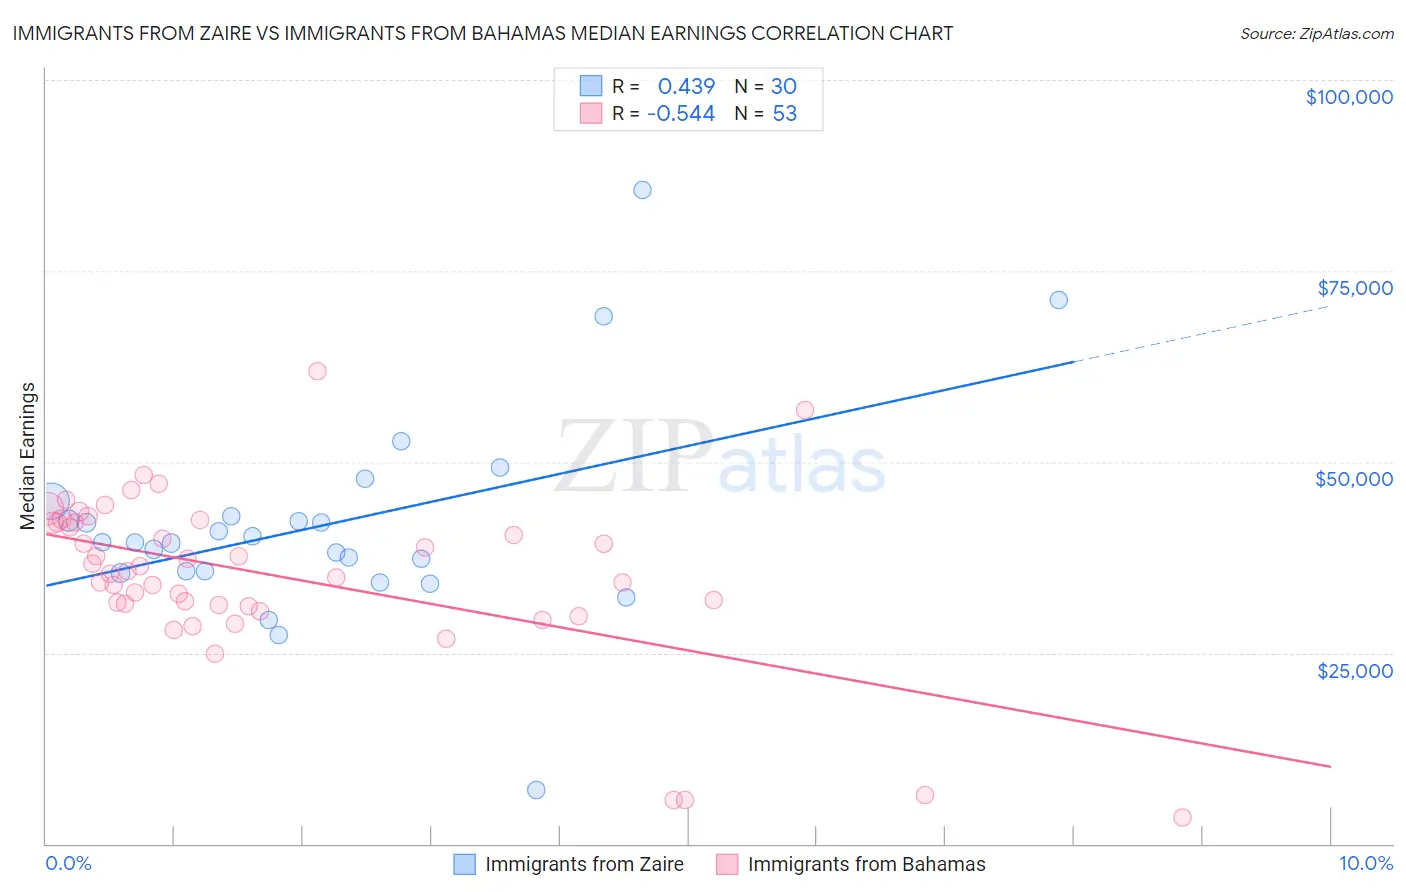
Immigrants from Zaire vs Immigrants from Bahamas Median Earnings Correlation Chart
The statistical analysis conducted on geographies consisting of 107,255,584 people shows a moderate positive correlation between the proportion of Immigrants from Zaire and median earnings in the United States with a correlation coefficient (R) of 0.439 and weighted average of $41,325. Similarly, the statistical analysis conducted on geographies consisting of 104,655,250 people shows a substantial negative correlation between the proportion of Immigrants from Bahamas and median earnings in the United States with a correlation coefficient (R) of -0.544 and weighted average of $39,861, a difference of 3.7%.
Median Earnings Correlation Summary
| Measurement | Immigrants from Zaire | Immigrants from Bahamas |
| Minimum | $7,065 | $3,467 |
| Maximum | $85,536 | $61,875 |
| Range | $78,471 | $58,408 |
| Mean | $41,788 | $35,101 |
| Median | $39,475 | $35,644 |
| Interquartile 25% (IQ1) | $35,616 | $31,209 |
| Interquartile 75% (IQ3) | $42,826 | $42,043 |
| Interquartile Range (IQR) | $7,210 | $10,834 |
| Standard Deviation (Sample) | $14,049 | $11,156 |
| Standard Deviation (Population) | $13,813 | $11,051 |
Similar Demographics by Median Earnings
Demographics Similar to Immigrants from Zaire by Median Earnings
In terms of median earnings, the demographic groups most similar to Immigrants from Zaire are Potawatomi ($41,288, a difference of 0.090%), Bangladeshi ($41,263, a difference of 0.15%), Cherokee ($41,252, a difference of 0.18%), Guatemalan ($41,205, a difference of 0.29%), and U.S. Virgin Islander ($41,448, a difference of 0.30%).
| Demographics | Rating | Rank | Median Earnings |
| Mexican American Indians | 0.1 /100 | #286 | Tragic $41,719 |
| Indonesians | 0.1 /100 | #287 | Tragic $41,701 |
| Immigrants | Dominican Republic | 0.1 /100 | #288 | Tragic $41,554 |
| Comanche | 0.1 /100 | #289 | Tragic $41,519 |
| Paiute | 0.1 /100 | #290 | Tragic $41,508 |
| Central American Indians | 0.1 /100 | #291 | Tragic $41,474 |
| U.S. Virgin Islanders | 0.1 /100 | #292 | Tragic $41,448 |
| Immigrants | Zaire | 0.1 /100 | #293 | Tragic $41,325 |
| Potawatomi | 0.1 /100 | #294 | Tragic $41,288 |
| Bangladeshis | 0.1 /100 | #295 | Tragic $41,263 |
| Cherokee | 0.1 /100 | #296 | Tragic $41,252 |
| Guatemalans | 0.1 /100 | #297 | Tragic $41,205 |
| Immigrants | Micronesia | 0.1 /100 | #298 | Tragic $41,133 |
| Immigrants | Caribbean | 0.1 /100 | #299 | Tragic $41,119 |
| Ute | 0.1 /100 | #300 | Tragic $41,051 |
Demographics Similar to Immigrants from Bahamas by Median Earnings
In terms of median earnings, the demographic groups most similar to Immigrants from Bahamas are Mexican ($39,834, a difference of 0.070%), Immigrants from Central America ($39,762, a difference of 0.25%), Bahamian ($39,735, a difference of 0.32%), Ottawa ($39,721, a difference of 0.35%), and Creek ($39,648, a difference of 0.54%).
| Demographics | Rating | Rank | Median Earnings |
| Choctaw | 0.0 /100 | #313 | Tragic $40,270 |
| Cheyenne | 0.0 /100 | #314 | Tragic $40,233 |
| Seminole | 0.0 /100 | #315 | Tragic $40,233 |
| Immigrants | Honduras | 0.0 /100 | #316 | Tragic $40,195 |
| Fijians | 0.0 /100 | #317 | Tragic $40,193 |
| Dutch West Indians | 0.0 /100 | #318 | Tragic $40,107 |
| Blacks/African Americans | 0.0 /100 | #319 | Tragic $40,085 |
| Immigrants | Bahamas | 0.0 /100 | #320 | Tragic $39,861 |
| Mexicans | 0.0 /100 | #321 | Tragic $39,834 |
| Immigrants | Central America | 0.0 /100 | #322 | Tragic $39,762 |
| Bahamians | 0.0 /100 | #323 | Tragic $39,735 |
| Ottawa | 0.0 /100 | #324 | Tragic $39,721 |
| Creek | 0.0 /100 | #325 | Tragic $39,648 |
| Immigrants | Yemen | 0.0 /100 | #326 | Tragic $39,540 |
| Yuman | 0.0 /100 | #327 | Tragic $39,523 |