Immigrants from Zaire vs Chilean Median Earnings
COMPARE
Immigrants from Zaire
Chilean
Median Earnings
Median Earnings Comparison
Immigrants from Zaire
Chileans
$41,325
MEDIAN EARNINGS
0.1/ 100
METRIC RATING
293rd/ 347
METRIC RANK
$48,504
MEDIAN EARNINGS
94.8/ 100
METRIC RATING
122nd/ 347
METRIC RANK
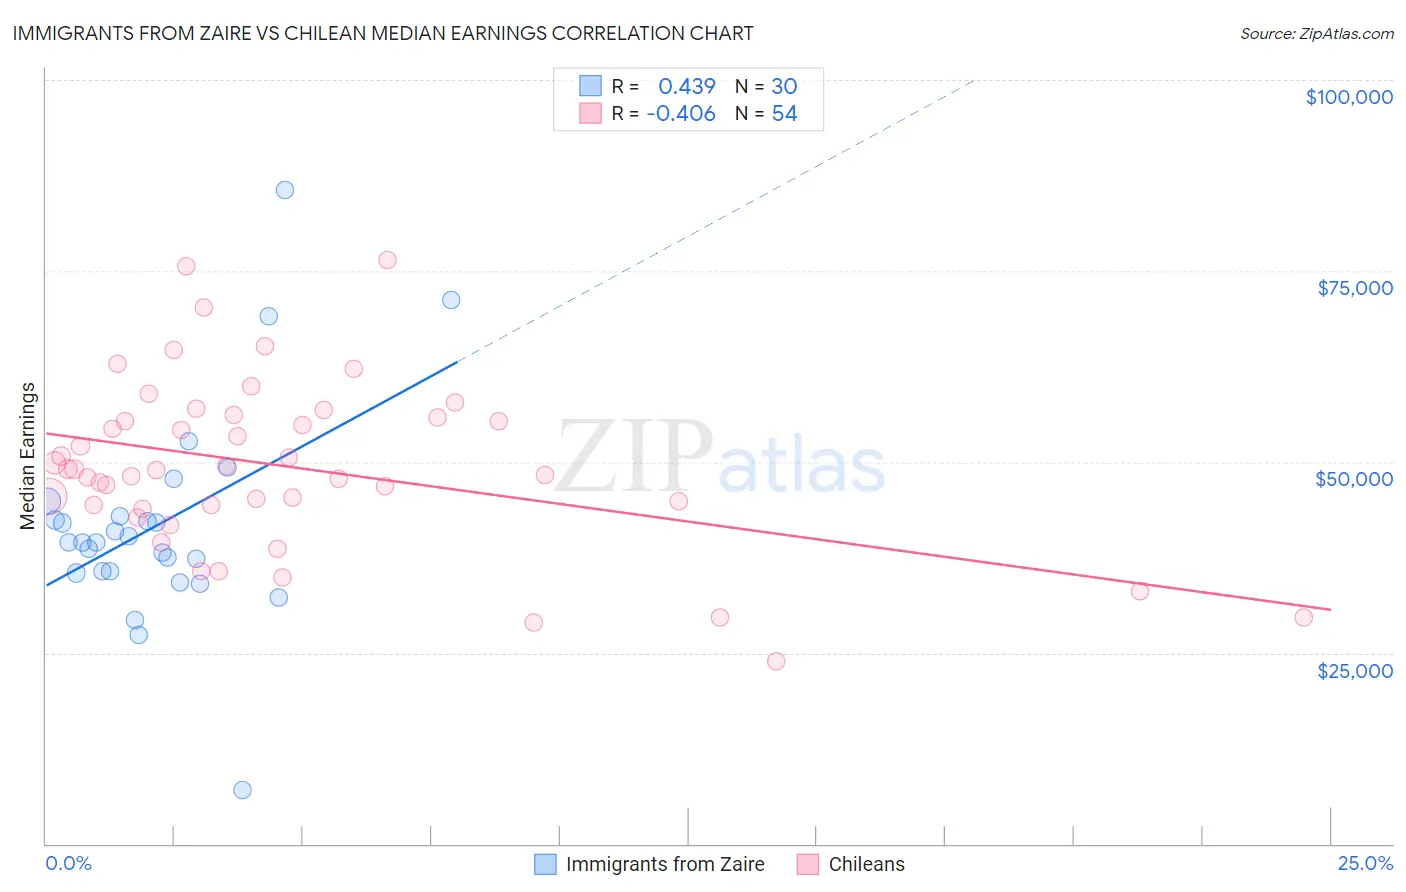
Immigrants from Zaire vs Chilean Median Earnings Correlation Chart
The statistical analysis conducted on geographies consisting of 107,255,584 people shows a moderate positive correlation between the proportion of Immigrants from Zaire and median earnings in the United States with a correlation coefficient (R) of 0.439 and weighted average of $41,325. Similarly, the statistical analysis conducted on geographies consisting of 256,682,531 people shows a moderate negative correlation between the proportion of Chileans and median earnings in the United States with a correlation coefficient (R) of -0.406 and weighted average of $48,504, a difference of 17.4%.
Median Earnings Correlation Summary
| Measurement | Immigrants from Zaire | Chilean |
| Minimum | $7,065 | $23,911 |
| Maximum | $85,536 | $76,406 |
| Range | $78,471 | $52,495 |
| Mean | $41,788 | $49,382 |
| Median | $39,475 | $48,999 |
| Interquartile 25% (IQ1) | $35,616 | $44,321 |
| Interquartile 75% (IQ3) | $42,826 | $55,791 |
| Interquartile Range (IQR) | $7,210 | $11,470 |
| Standard Deviation (Sample) | $14,049 | $11,094 |
| Standard Deviation (Population) | $13,813 | $10,991 |
Similar Demographics by Median Earnings
Demographics Similar to Immigrants from Zaire by Median Earnings
In terms of median earnings, the demographic groups most similar to Immigrants from Zaire are Potawatomi ($41,288, a difference of 0.090%), Bangladeshi ($41,263, a difference of 0.15%), Cherokee ($41,252, a difference of 0.18%), Guatemalan ($41,205, a difference of 0.29%), and U.S. Virgin Islander ($41,448, a difference of 0.30%).
| Demographics | Rating | Rank | Median Earnings |
| Mexican American Indians | 0.1 /100 | #286 | Tragic $41,719 |
| Indonesians | 0.1 /100 | #287 | Tragic $41,701 |
| Immigrants | Dominican Republic | 0.1 /100 | #288 | Tragic $41,554 |
| Comanche | 0.1 /100 | #289 | Tragic $41,519 |
| Paiute | 0.1 /100 | #290 | Tragic $41,508 |
| Central American Indians | 0.1 /100 | #291 | Tragic $41,474 |
| U.S. Virgin Islanders | 0.1 /100 | #292 | Tragic $41,448 |
| Immigrants | Zaire | 0.1 /100 | #293 | Tragic $41,325 |
| Potawatomi | 0.1 /100 | #294 | Tragic $41,288 |
| Bangladeshis | 0.1 /100 | #295 | Tragic $41,263 |
| Cherokee | 0.1 /100 | #296 | Tragic $41,252 |
| Guatemalans | 0.1 /100 | #297 | Tragic $41,205 |
| Immigrants | Micronesia | 0.1 /100 | #298 | Tragic $41,133 |
| Immigrants | Caribbean | 0.1 /100 | #299 | Tragic $41,119 |
| Ute | 0.1 /100 | #300 | Tragic $41,051 |
Demographics Similar to Chileans by Median Earnings
In terms of median earnings, the demographic groups most similar to Chileans are Arab ($48,599, a difference of 0.19%), Carpatho Rusyn ($48,617, a difference of 0.23%), Immigrants from Syria ($48,375, a difference of 0.27%), Brazilian ($48,356, a difference of 0.31%), and Polish ($48,659, a difference of 0.32%).
| Demographics | Rating | Rank | Median Earnings |
| Chinese | 96.7 /100 | #115 | Exceptional $48,836 |
| Koreans | 96.2 /100 | #116 | Exceptional $48,727 |
| Serbians | 95.9 /100 | #117 | Exceptional $48,677 |
| Immigrants | Jordan | 95.9 /100 | #118 | Exceptional $48,673 |
| Poles | 95.8 /100 | #119 | Exceptional $48,659 |
| Carpatho Rusyns | 95.5 /100 | #120 | Exceptional $48,617 |
| Arabs | 95.4 /100 | #121 | Exceptional $48,599 |
| Chileans | 94.8 /100 | #122 | Exceptional $48,504 |
| Immigrants | Syria | 93.9 /100 | #123 | Exceptional $48,375 |
| Brazilians | 93.7 /100 | #124 | Exceptional $48,356 |
| Immigrants | Fiji | 93.3 /100 | #125 | Exceptional $48,305 |
| Assyrians/Chaldeans/Syriacs | 93.3 /100 | #126 | Exceptional $48,304 |
| Sierra Leoneans | 93.1 /100 | #127 | Exceptional $48,286 |
| Immigrants | Philippines | 92.9 /100 | #128 | Exceptional $48,266 |
| Pakistanis | 92.8 /100 | #129 | Exceptional $48,254 |