Immigrants from Zaire vs Jamaican Median Earnings
COMPARE
Immigrants from Zaire
Jamaican
Median Earnings
Median Earnings Comparison
Immigrants from Zaire
Jamaicans
$41,325
MEDIAN EARNINGS
0.1/ 100
METRIC RATING
293rd/ 347
METRIC RANK
$43,343
MEDIAN EARNINGS
1.3/ 100
METRIC RATING
257th/ 347
METRIC RANK
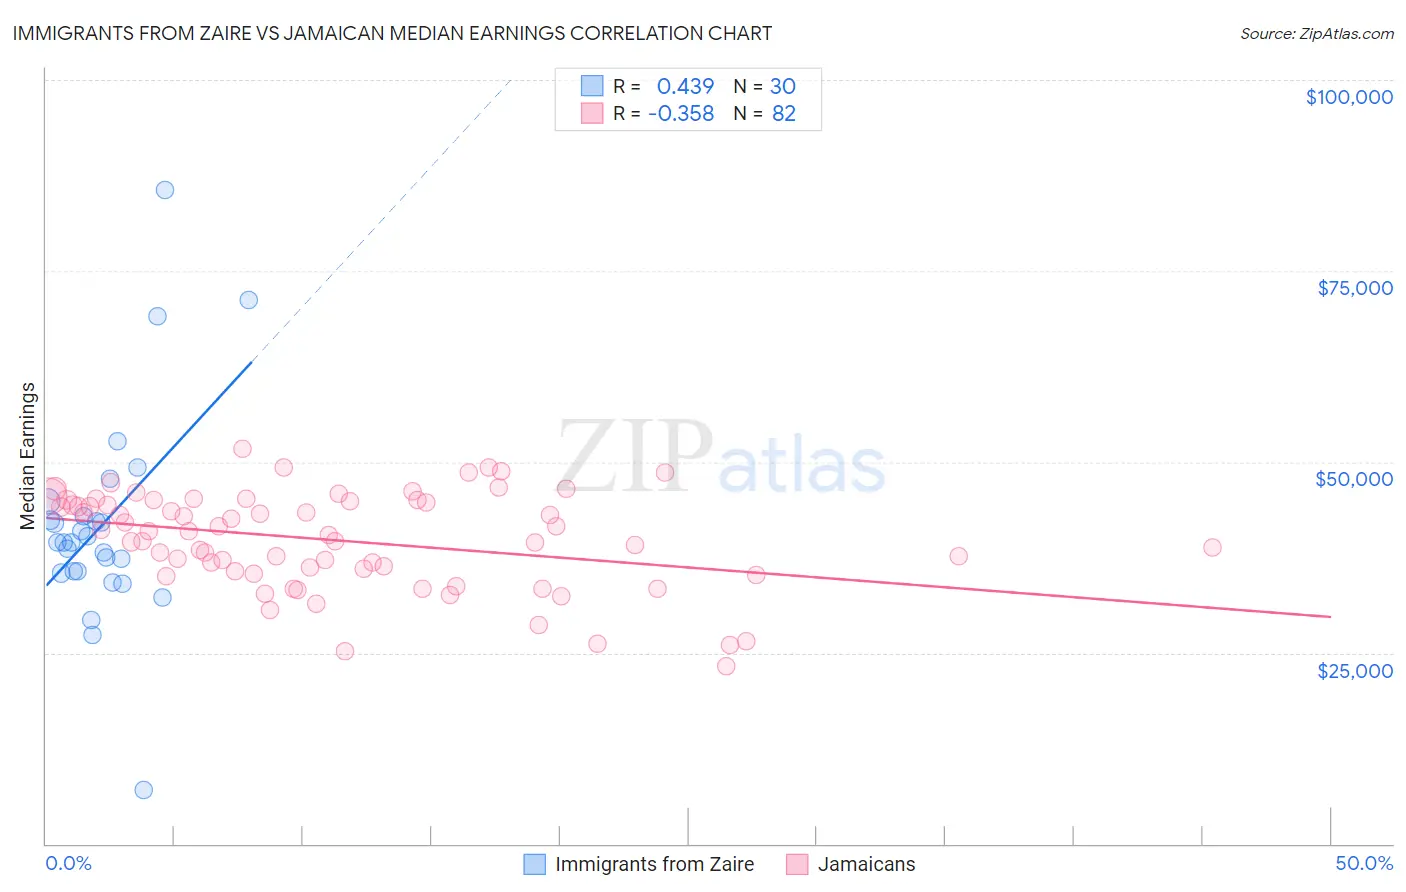
Immigrants from Zaire vs Jamaican Median Earnings Correlation Chart
The statistical analysis conducted on geographies consisting of 107,255,584 people shows a moderate positive correlation between the proportion of Immigrants from Zaire and median earnings in the United States with a correlation coefficient (R) of 0.439 and weighted average of $41,325. Similarly, the statistical analysis conducted on geographies consisting of 368,067,864 people shows a mild negative correlation between the proportion of Jamaicans and median earnings in the United States with a correlation coefficient (R) of -0.358 and weighted average of $43,343, a difference of 4.9%.
Median Earnings Correlation Summary
| Measurement | Immigrants from Zaire | Jamaican |
| Minimum | $7,065 | $23,316 |
| Maximum | $85,536 | $51,789 |
| Range | $78,471 | $28,473 |
| Mean | $41,788 | $39,739 |
| Median | $39,475 | $40,605 |
| Interquartile 25% (IQ1) | $35,616 | $35,749 |
| Interquartile 75% (IQ3) | $42,826 | $44,901 |
| Interquartile Range (IQR) | $7,210 | $9,152 |
| Standard Deviation (Sample) | $14,049 | $6,295 |
| Standard Deviation (Population) | $13,813 | $6,257 |
Similar Demographics by Median Earnings
Demographics Similar to Immigrants from Zaire by Median Earnings
In terms of median earnings, the demographic groups most similar to Immigrants from Zaire are Potawatomi ($41,288, a difference of 0.090%), Bangladeshi ($41,263, a difference of 0.15%), Cherokee ($41,252, a difference of 0.18%), Guatemalan ($41,205, a difference of 0.29%), and U.S. Virgin Islander ($41,448, a difference of 0.30%).
| Demographics | Rating | Rank | Median Earnings |
| Mexican American Indians | 0.1 /100 | #286 | Tragic $41,719 |
| Indonesians | 0.1 /100 | #287 | Tragic $41,701 |
| Immigrants | Dominican Republic | 0.1 /100 | #288 | Tragic $41,554 |
| Comanche | 0.1 /100 | #289 | Tragic $41,519 |
| Paiute | 0.1 /100 | #290 | Tragic $41,508 |
| Central American Indians | 0.1 /100 | #291 | Tragic $41,474 |
| U.S. Virgin Islanders | 0.1 /100 | #292 | Tragic $41,448 |
| Immigrants | Zaire | 0.1 /100 | #293 | Tragic $41,325 |
| Potawatomi | 0.1 /100 | #294 | Tragic $41,288 |
| Bangladeshis | 0.1 /100 | #295 | Tragic $41,263 |
| Cherokee | 0.1 /100 | #296 | Tragic $41,252 |
| Guatemalans | 0.1 /100 | #297 | Tragic $41,205 |
| Immigrants | Micronesia | 0.1 /100 | #298 | Tragic $41,133 |
| Immigrants | Caribbean | 0.1 /100 | #299 | Tragic $41,119 |
| Ute | 0.1 /100 | #300 | Tragic $41,051 |
Demographics Similar to Jamaicans by Median Earnings
In terms of median earnings, the demographic groups most similar to Jamaicans are French American Indian ($43,333, a difference of 0.020%), Alaskan Athabascan ($43,393, a difference of 0.12%), Immigrants from Middle Africa ($43,416, a difference of 0.17%), German Russian ($43,200, a difference of 0.33%), and Liberian ($43,536, a difference of 0.45%).
| Demographics | Rating | Rank | Median Earnings |
| Alaska Natives | 2.3 /100 | #250 | Tragic $43,750 |
| Tsimshian | 2.1 /100 | #251 | Tragic $43,695 |
| Hawaiians | 2.0 /100 | #252 | Tragic $43,673 |
| Somalis | 1.8 /100 | #253 | Tragic $43,567 |
| Liberians | 1.7 /100 | #254 | Tragic $43,536 |
| Immigrants | Middle Africa | 1.4 /100 | #255 | Tragic $43,416 |
| Alaskan Athabascans | 1.4 /100 | #256 | Tragic $43,393 |
| Jamaicans | 1.3 /100 | #257 | Tragic $43,343 |
| French American Indians | 1.3 /100 | #258 | Tragic $43,333 |
| German Russians | 1.1 /100 | #259 | Tragic $43,200 |
| Immigrants | Somalia | 0.9 /100 | #260 | Tragic $43,100 |
| Immigrants | Jamaica | 0.8 /100 | #261 | Tragic $43,026 |
| Nicaraguans | 0.8 /100 | #262 | Tragic $43,026 |
| Inupiat | 0.8 /100 | #263 | Tragic $43,000 |
| Immigrants | Liberia | 0.7 /100 | #264 | Tragic $42,923 |