Armenian vs Immigrants from Eritrea Median Earnings
COMPARE
Armenian
Immigrants from Eritrea
Median Earnings
Median Earnings Comparison
Armenians
Immigrants from Eritrea
$49,804
MEDIAN EARNINGS
99.1/ 100
METRIC RATING
93rd/ 347
METRIC RANK
$47,657
MEDIAN EARNINGS
84.8/ 100
METRIC RATING
148th/ 347
METRIC RANK
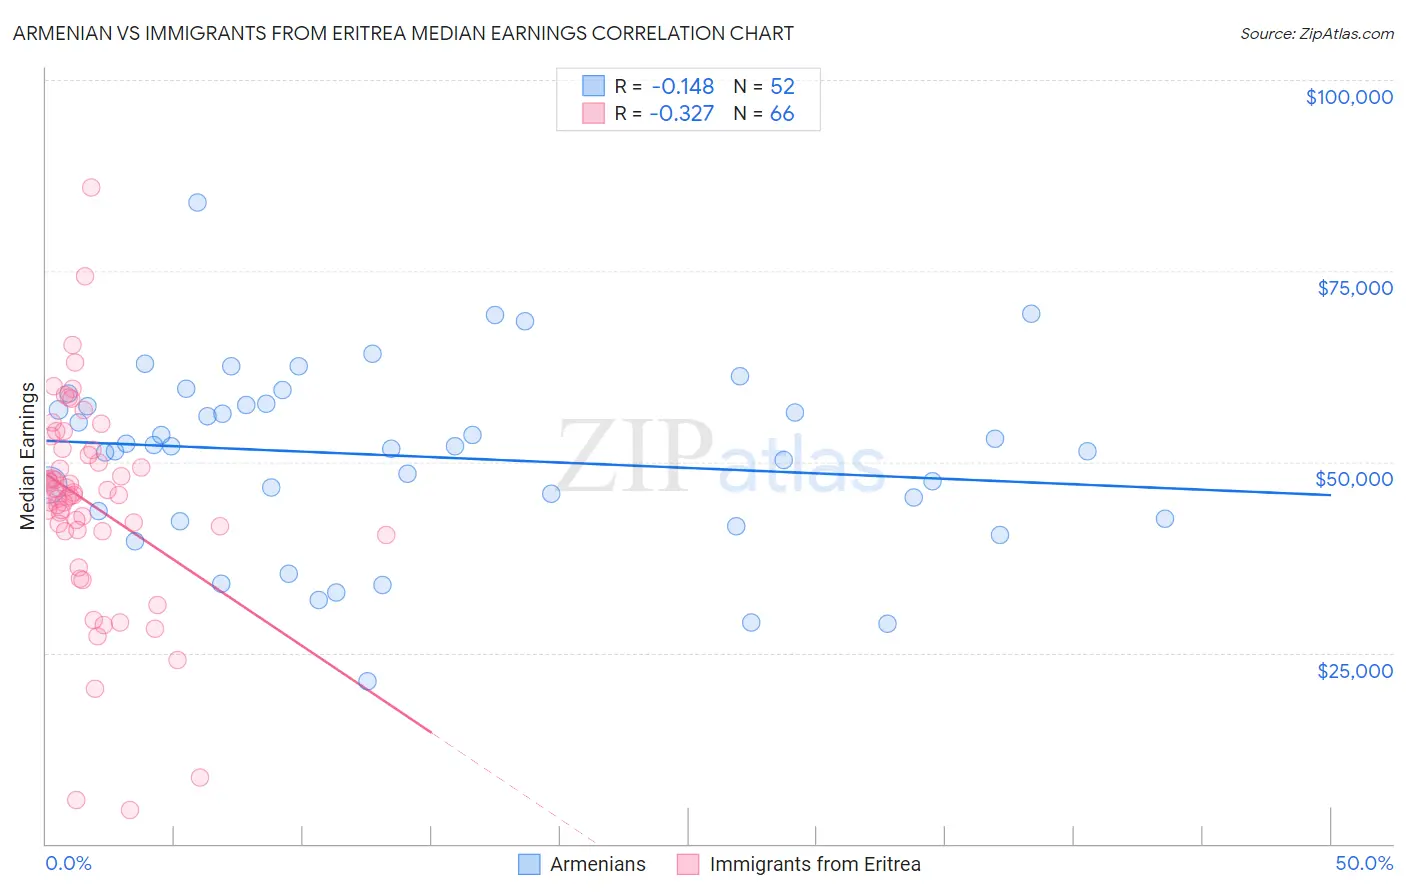
Armenian vs Immigrants from Eritrea Median Earnings Correlation Chart
The statistical analysis conducted on geographies consisting of 310,945,861 people shows a poor negative correlation between the proportion of Armenians and median earnings in the United States with a correlation coefficient (R) of -0.148 and weighted average of $49,804. Similarly, the statistical analysis conducted on geographies consisting of 104,854,314 people shows a mild negative correlation between the proportion of Immigrants from Eritrea and median earnings in the United States with a correlation coefficient (R) of -0.327 and weighted average of $47,657, a difference of 4.5%.
Median Earnings Correlation Summary
| Measurement | Armenian | Immigrants from Eritrea |
| Minimum | $21,250 | $4,426 |
| Maximum | $84,019 | $85,924 |
| Range | $62,769 | $81,498 |
| Mean | $50,725 | $44,557 |
| Median | $52,028 | $45,626 |
| Interquartile 25% (IQ1) | $43,022 | $40,964 |
| Interquartile 75% (IQ3) | $57,580 | $51,547 |
| Interquartile Range (IQR) | $14,558 | $10,583 |
| Standard Deviation (Sample) | $11,922 | $13,912 |
| Standard Deviation (Population) | $11,807 | $13,806 |
Similar Demographics by Median Earnings
Demographics Similar to Armenians by Median Earnings
In terms of median earnings, the demographic groups most similar to Armenians are Immigrants from Argentina ($49,841, a difference of 0.070%), Croatian ($49,724, a difference of 0.16%), Immigrants from England ($49,722, a difference of 0.16%), Macedonian ($49,893, a difference of 0.18%), and Italian ($49,915, a difference of 0.22%).
| Demographics | Rating | Rank | Median Earnings |
| Immigrants | Canada | 99.5 /100 | #86 | Exceptional $50,192 |
| Immigrants | Uzbekistan | 99.5 /100 | #87 | Exceptional $50,151 |
| Albanians | 99.4 /100 | #88 | Exceptional $50,116 |
| Immigrants | North America | 99.4 /100 | #89 | Exceptional $50,108 |
| Italians | 99.3 /100 | #90 | Exceptional $49,915 |
| Macedonians | 99.2 /100 | #91 | Exceptional $49,893 |
| Immigrants | Argentina | 99.2 /100 | #92 | Exceptional $49,841 |
| Armenians | 99.1 /100 | #93 | Exceptional $49,804 |
| Croatians | 99.0 /100 | #94 | Exceptional $49,724 |
| Immigrants | England | 99.0 /100 | #95 | Exceptional $49,722 |
| Immigrants | Lebanon | 99.0 /100 | #96 | Exceptional $49,682 |
| Immigrants | North Macedonia | 98.9 /100 | #97 | Exceptional $49,658 |
| Immigrants | Northern Africa | 98.9 /100 | #98 | Exceptional $49,648 |
| Immigrants | Afghanistan | 98.9 /100 | #99 | Exceptional $49,645 |
| Immigrants | Poland | 98.9 /100 | #100 | Exceptional $49,633 |
Demographics Similar to Immigrants from Eritrea by Median Earnings
In terms of median earnings, the demographic groups most similar to Immigrants from Eritrea are Immigrants from South Eastern Asia ($47,671, a difference of 0.030%), Luxembourger ($47,640, a difference of 0.040%), Peruvian ($47,628, a difference of 0.060%), Immigrants from Chile ($47,697, a difference of 0.080%), and Immigrants from Oceania ($47,617, a difference of 0.080%).
| Demographics | Rating | Rank | Median Earnings |
| Immigrants | Sierra Leone | 88.3 /100 | #141 | Excellent $47,875 |
| Ugandans | 88.0 /100 | #142 | Excellent $47,854 |
| Swedes | 88.0 /100 | #143 | Excellent $47,851 |
| Hungarians | 87.1 /100 | #144 | Excellent $47,795 |
| Immigrants | Saudi Arabia | 85.6 /100 | #145 | Excellent $47,704 |
| Immigrants | Chile | 85.5 /100 | #146 | Excellent $47,697 |
| Immigrants | South Eastern Asia | 85.0 /100 | #147 | Excellent $47,671 |
| Immigrants | Eritrea | 84.8 /100 | #148 | Excellent $47,657 |
| Luxembourgers | 84.5 /100 | #149 | Excellent $47,640 |
| Peruvians | 84.2 /100 | #150 | Excellent $47,628 |
| Immigrants | Oceania | 84.1 /100 | #151 | Excellent $47,617 |
| Immigrants | Germany | 83.1 /100 | #152 | Excellent $47,566 |
| Slavs | 81.1 /100 | #153 | Excellent $47,470 |
| Immigrants | Portugal | 77.3 /100 | #154 | Good $47,304 |
| Immigrants | Vietnam | 76.7 /100 | #155 | Good $47,282 |