European vs Immigrants from Eritrea Median Earnings
COMPARE
European
Immigrants from Eritrea
Median Earnings
Median Earnings Comparison
Europeans
Immigrants from Eritrea
$47,915
MEDIAN EARNINGS
88.9/ 100
METRIC RATING
138th/ 347
METRIC RANK
$47,657
MEDIAN EARNINGS
84.8/ 100
METRIC RATING
148th/ 347
METRIC RANK
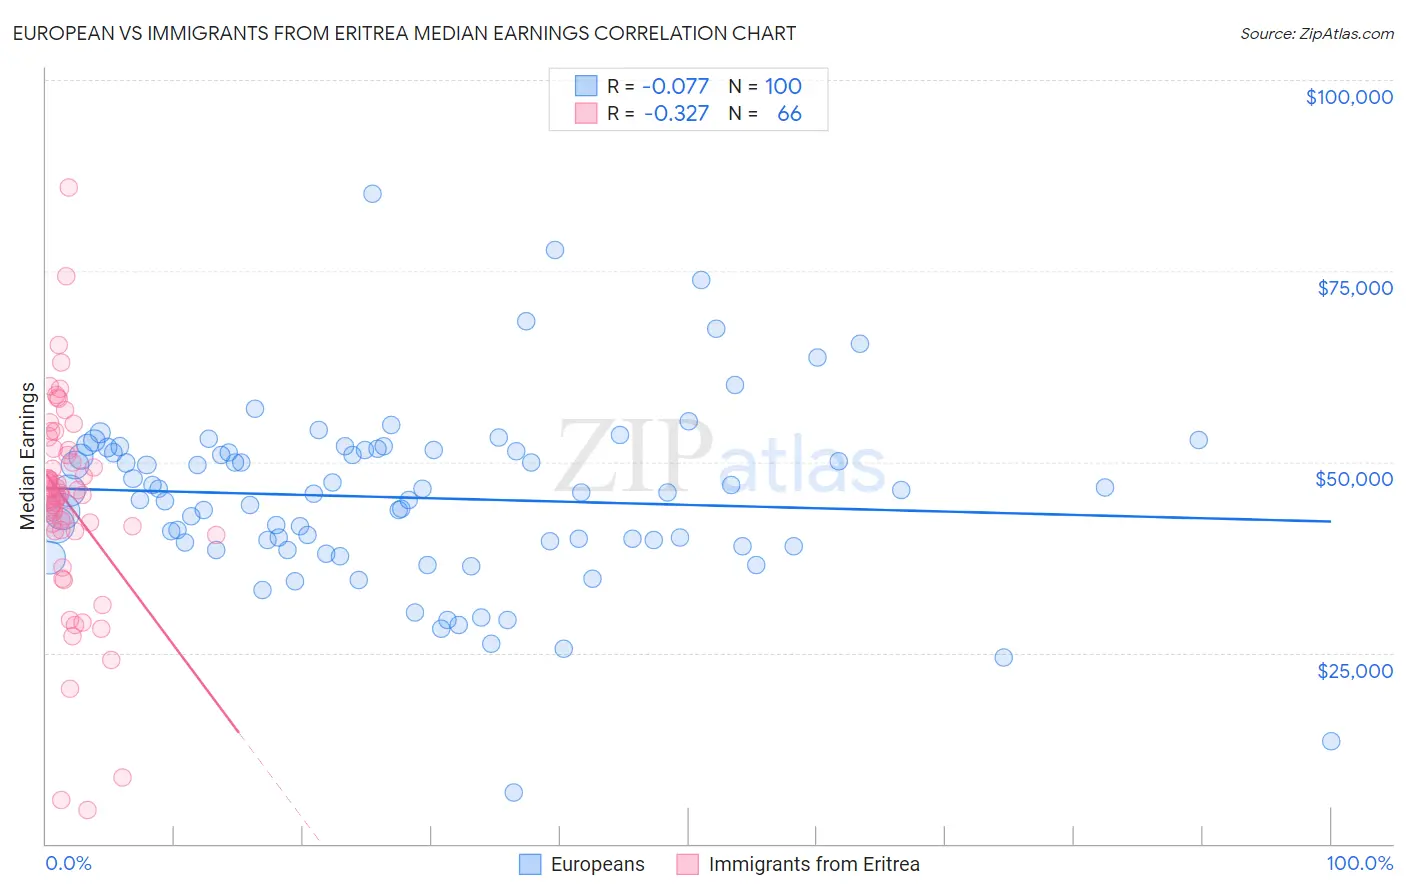
European vs Immigrants from Eritrea Median Earnings Correlation Chart
The statistical analysis conducted on geographies consisting of 561,558,991 people shows a slight negative correlation between the proportion of Europeans and median earnings in the United States with a correlation coefficient (R) of -0.077 and weighted average of $47,915. Similarly, the statistical analysis conducted on geographies consisting of 104,854,314 people shows a mild negative correlation between the proportion of Immigrants from Eritrea and median earnings in the United States with a correlation coefficient (R) of -0.327 and weighted average of $47,657, a difference of 0.54%.
Median Earnings Correlation Summary
| Measurement | European | Immigrants from Eritrea |
| Minimum | $6,651 | $4,426 |
| Maximum | $85,181 | $85,924 |
| Range | $78,530 | $81,498 |
| Mean | $45,294 | $44,557 |
| Median | $45,994 | $45,626 |
| Interquartile 25% (IQ1) | $39,170 | $40,964 |
| Interquartile 75% (IQ3) | $51,535 | $51,547 |
| Interquartile Range (IQR) | $12,364 | $10,583 |
| Standard Deviation (Sample) | $11,738 | $13,912 |
| Standard Deviation (Population) | $11,679 | $13,806 |
Demographics Similar to Europeans and Immigrants from Eritrea by Median Earnings
In terms of median earnings, the demographic groups most similar to Europeans are Canadian ($47,911, a difference of 0.010%), Immigrants from Nepal ($47,925, a difference of 0.020%), Taiwanese ($47,902, a difference of 0.030%), Immigrants from Sierra Leone ($47,875, a difference of 0.080%), and Ugandan ($47,854, a difference of 0.13%). Similarly, the demographic groups most similar to Immigrants from Eritrea are Immigrants from South Eastern Asia ($47,671, a difference of 0.030%), Luxembourger ($47,640, a difference of 0.040%), Peruvian ($47,628, a difference of 0.060%), Immigrants from Chile ($47,697, a difference of 0.080%), and Immigrants from Oceania ($47,617, a difference of 0.080%).
| Demographics | Rating | Rank | Median Earnings |
| Immigrants | Uganda | 90.5 /100 | #133 | Exceptional $48,041 |
| Sri Lankans | 90.5 /100 | #134 | Exceptional $48,040 |
| Portuguese | 90.4 /100 | #135 | Exceptional $48,032 |
| Slovenes | 90.0 /100 | #136 | Excellent $47,995 |
| Immigrants | Nepal | 89.0 /100 | #137 | Excellent $47,925 |
| Europeans | 88.9 /100 | #138 | Excellent $47,915 |
| Canadians | 88.8 /100 | #139 | Excellent $47,911 |
| Taiwanese | 88.7 /100 | #140 | Excellent $47,902 |
| Immigrants | Sierra Leone | 88.3 /100 | #141 | Excellent $47,875 |
| Ugandans | 88.0 /100 | #142 | Excellent $47,854 |
| Swedes | 88.0 /100 | #143 | Excellent $47,851 |
| Hungarians | 87.1 /100 | #144 | Excellent $47,795 |
| Immigrants | Saudi Arabia | 85.6 /100 | #145 | Excellent $47,704 |
| Immigrants | Chile | 85.5 /100 | #146 | Excellent $47,697 |
| Immigrants | South Eastern Asia | 85.0 /100 | #147 | Excellent $47,671 |
| Immigrants | Eritrea | 84.8 /100 | #148 | Excellent $47,657 |
| Luxembourgers | 84.5 /100 | #149 | Excellent $47,640 |
| Peruvians | 84.2 /100 | #150 | Excellent $47,628 |
| Immigrants | Oceania | 84.1 /100 | #151 | Excellent $47,617 |
| Immigrants | Germany | 83.1 /100 | #152 | Excellent $47,566 |
| Slavs | 81.1 /100 | #153 | Excellent $47,470 |